Explanation of Rounding Bottom Candlestick
X
  • وقت
  • دکھائیں
Clear All
new posts
  • #1 Collapse

    Explanation of Rounding Bottom Candlestick
    Introduction.

    jab aap Forex trading market mein successful hona chahte Hain, to aapko hamesha market mein Technical Analysis ko complete karna hota hai. Technical Analysis ko perfect bananay Kay liye apko market main Different Candlestick Pattern, individual candlesticks, support level, resistance level, trend line, Candlestick Pattern ko study karna hota hai. Agar aap market mein different important analysis ko completely understand kar lete hain, to definitely aap ko bahut jyada advantages hasil ho sakte hain. Technical Analysis ko complete karny Kay liye jab aap different important Candlestick Pattern ko study kar rahe hote hain, tu ismein aik bahut hi familiar pattern, jisko aap rounding Bottom Candlestick Pattern ka name sa janty Hain, us sa related kuch important information share krna chahata Hun.

    Rounding Bottom Candlestick Pattern in Forex Trading?

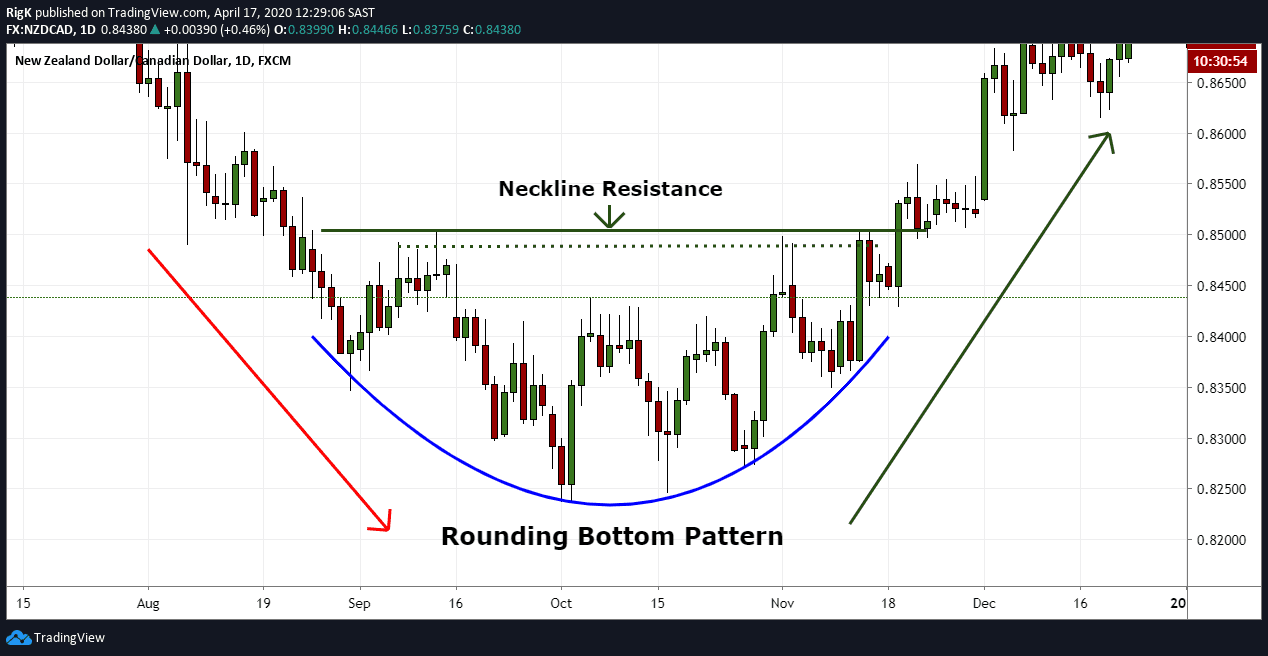
    Dear Forex trading market mein jab bearish movement ho rahi hoti hai, or market gradually downwards movement kar rahi hoti hai, tu sometime aap ko aik round shape find out ho sakhti hai, is Candlestick Pattern ko aap rounding Bottom Candlestick Pattern keh sakhty Hain.

    Identification of Rounding Bottom on Trading Chart

    Dear Forex trading mein agar aap rounding Bottom Candlestick Pattern ko identify krna hota hai, tu isk liye consistently market main bearish movement ho rahi hoti hai. Or gradually decline hoty huye aik support level par bullish trend main jana start kaar deti hai Is candlestick pattern ko carefully focus karna aasan hota hai.

    Interpretation of Rounding Bottom

    Agar aap Forex trading market mein Rounding Bottom Candlestick Pattern ko recognize Kar laty Hain, tu isk bad aapko Market mein bahut hi acchi buying entry mil sakhti hai. Jab market mein is Candlestick Pattern Kay bad buying trend milta hai, tu aapko aik achi strong support sa entry mil sakhti hai.


    Click image for larger version

Name:	rounded.png
Views:	1
Size:	295.3 کلوبائٹ
ID:	12478472
  • <a href="https://www.instaforex.org/ru/?x=ruforum">InstaForex</a>
  • #2 Collapse

    Rounding Bottom Candlestick chart pattern, forex trading mein kafi common aur useful chart pattern hai. Yeh pattern typically long-term chart par form hota hai aur bullish trend kay sath associated hota hai. Rounding Bottom pattern, price action kay zariye support level ki formation kay baad uptrend ki shuruwat ko indicate karta hai. Rounding Bottom pattern, bilkul aik U-shape ki tarah hota hai. Is pattern mein, price initially down-trend mein hota hai aur phir slowly support level kay qareeb aata hai. Support level kay paas aane kay baad, price kuch dair kay liye consolidate hota hai. Jab price phir se up-trend mein aata hai aur support level ko break karta hai, to yeh Rounding Bottom pattern complete ho jata hai. Is pattern ko identify karna kafi simple hai. Is kay liye trader ko long-term chart par price action kay sath sath Moving Averages bhi dekhna chahiye. Jab price support level kay qareeb aata hai, to is par kuch dair kay liye consolidation dekhne ko milti hai. Consolidation kay doran, price Moving Averages kay qareeb aata hai aur phir isay break karta hai. Jab price Moving Averages kay upper side se break karta hai aur uptrend mein aata hai, to yeh Rounding Bottom pattern complete hota hai. Rounding Bottom pattern ki trading strategy kay liye, trader ko confirmations ka wait karna chahiye. Jab price support level kay qareeb aata hai, to trader ko is ka confirmations kay liye wait karna chahiye. Confirmations kay liye, trader ko price action kay sath sath Moving Averages aur phir volume bhi dekhna chahiye. Jab price support level kay qareeb aata hai aur phir isay break karta hai, to trader ko confirmations kay liye wait karna chahiye. Confirmations kay liye, trader ko volume ka bhi analysis karna chahiye. Agar price support level ko break kar kay up-trend mein aata hai aur us kay sath volume bhi increase hoti hai, to yeh confirmations kay liye aik strong signal hai. Rounding Bottom pattern kay sath trading kay liye, trader ko stop-loss aur take-profit levels ko bhi set karna chahiye. Stop-loss level ko set karna, trader kay risk management strategy kay hisab se hota hai. Agar trader ki entry point support level kay upper side se hai, to us kay stop-loss level ko support level kay neechay set karna chahiye. Take-profit level ko set karna, trader kay trading plan kay hisab se hota hai. Agar trader ko long-term trading strategy par focus hai, to us kay take-profit level ko higher level par set karna chahiye. Agar trader ko short-term trading strategy par focus hai, to us kay take-profit level ko kuch kam level par set karna chahiye. Rounding Bottom Candlestick pattern ko identify karna kafi aasan hai. Is kay liye trader ko long-term chart par price action kay sath sath Moving Averages bhi dekhna chahiye. 
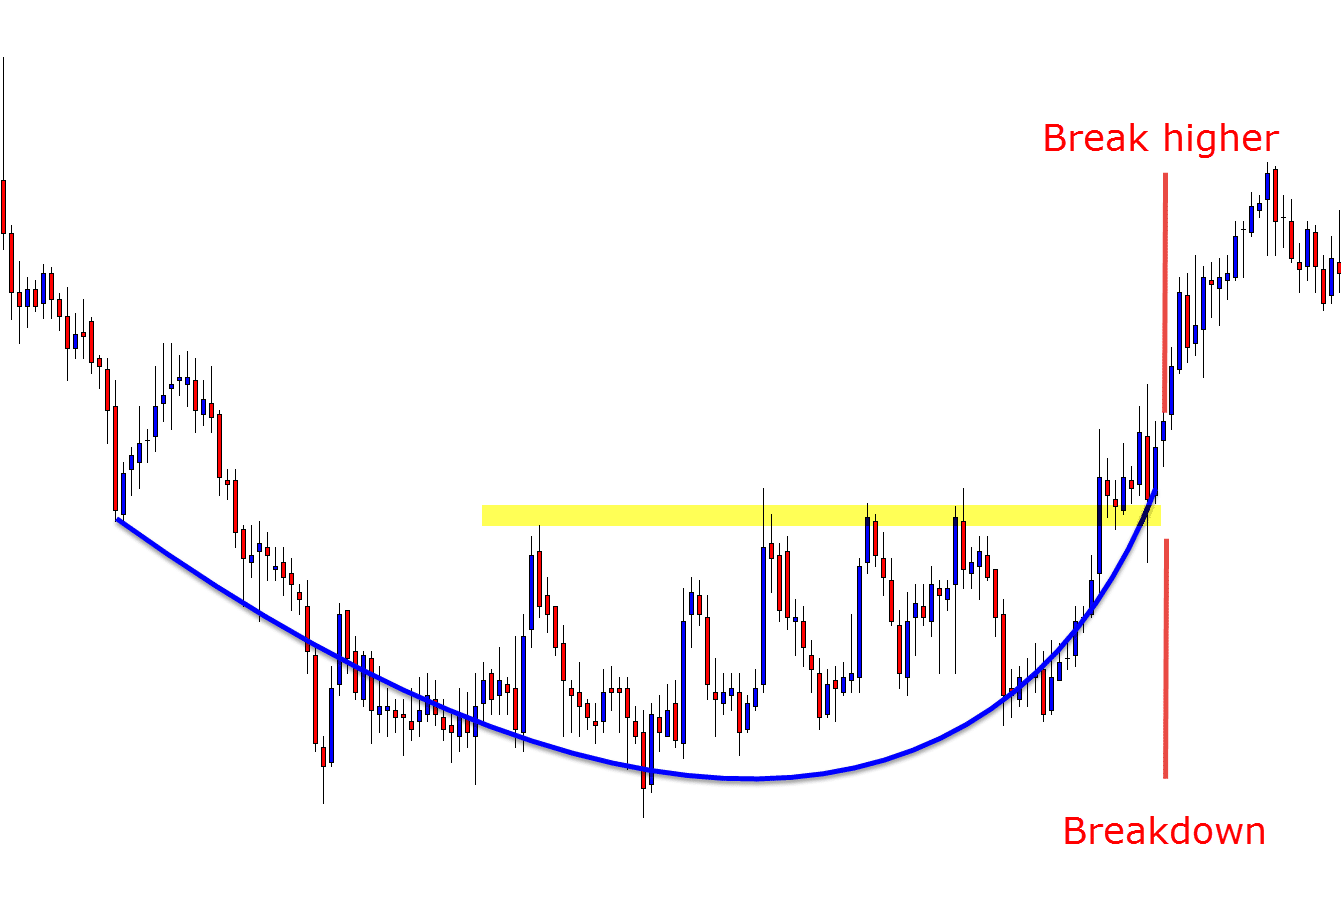
Yahan kuch tips hain jo trader ko Rounding Bottom pattern ko identify karnay mein help kar sakti hain:
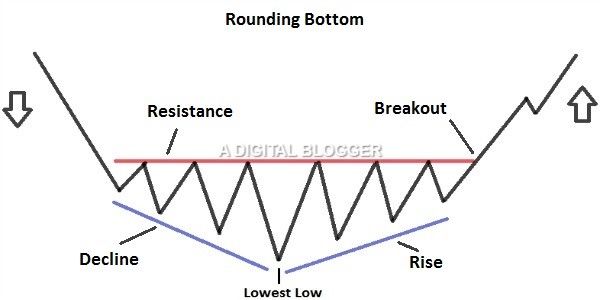
    • Long-term Chart: Rounding Bottom pattern typically long-term chart par form hota hai. Is pattern ko identify karnay kay liye trader ko long-term chart par focus karna chahiye, jis mein daily, weekly aur monthly timeframes shamil hotay hain.
    • Support Level: Rounding Bottom pattern mein price initially down-trend mein hota hai aur phir slowly support level kay qareeb aata hai. Support level ko identify karna kafi ahmiyat rakhta hai, kyunki yeh pattern kay formation kay liye crucial hai.
    • U-Shape: Rounding Bottom pattern, bilkul aik U-shape ki tarah hota hai. Jab price support level kay qareeb aata hai, to is par kuch dair kay liye consolidation dekhne ko milti hai. Jab price phir se up-trend mein aata hai aur support level ko break karta hai, to yeh Rounding Bottom pattern complete ho jata hai.
    • Moving Averages: Jab price support level kay qareeb aata hai aur phir isay break karta hai, to trader ko confirmations kay liye wait karna chahiye. Moving Averages bhi confirmations kay liye important hain, kyunki is say trader ko price direction ka pata chalta hai.
    • Volume: Confirmations kay liye, trader ko volume ka bhi analysis karna chahiye. Agar price support level ko break kar kay up-trend mein aata hai aur us kay sath volume bhi increase hoti hai, to yeh confirmations kay liye aik strong signal hai.
    • Patience: Rounding Bottom pattern kay sath trading kay liye, trader ko patience bahut ahmiyat rakhti hai. Is pattern kay confirmations kay liye, trader ko wait karna chahiye aur sabar kay sath trading karna chahiye.
    • Risk Management: Risk management strategies kay istemaal say trader apni trading mein risk ko manage kar sakta hai. Stop-loss aur take-profit levels ko set karna, trading mein risk management strategies kay hisab se kafi ahmiyat rakhta hai.
    Believe in yourself and your abilities. When you fight for your dreams, you can achieve anything.
    • <a href="https://www.instaforex.org/ru/?x=ruforum">InstaForex</a>
    • #3 Collapse

      Rounding Bottom Candlestick Chart Pattern - Forex Trading Guide Rounding Bottom Candlestick chart pattern aik bullish pattern hai jo traders ko trend reversal ka signal deta hai. Yeh pattern bearish trend k baad appear hota hai aur buyers ki strength ko show karta hai. Is pattern ka shape "U" ki tarah hota hai aur iski khasiyat hai k yeh candlestick chart pattern kafi lamba waqt leta hai develop honay mein. Is pattern ki sahi samajh aapko trading mein help kar sakti hai, isliye iski samajh boht zaroori hai. 1. Rounding Bottom Candlestick ki Tashkeel: Rounding Bottom Candlestick pattern ki tashkeel ki sorat mein, price action ke saath aik U-shape ki tarah hoti hai. Is pattern ki tashkeel mein, price action pehle bearish trend ko follow karti hai, phir gradual sa curve banata hai aur phir bullish trend ki taraf muntaqil ho jata hai. 2. Rounding Bottom Candlestick ki Pehchan: Rounding Bottom Candlestick pattern ki pehchan karne ke liye, humein iske saath doosre technical indicators ke saath dekhna hota hai. Price action ke saath, hum Moving Averages ya Fibonacci Retracement levels ka istemaal kar sakte hain. Agar market downtrend se rounding bottom pattern mein chala jata hai aur phir us ke upar se Moving Averages cross kartey hain, to yeh bullish trend ki sorat mein indicator hota hai. 3. Rounding Bottom Candlestick ki Tafseel: Jab market downtrend mein hota hai, to price action bearish hoti hai, lekin Rounding Bottom Candlestick pattern mein price action gradually curve banata hai aur phir bullish trend ki taraf chala jata hai. Yeh bullish trend ki sorat mein hota hai, jab market downtrend ke baad reversal hota hai aur phir upward direction mein jaata hai. 4. Rounding Bottom Candlestick ki Muddat: Rounding Bottom Candlestick pattern ki muddat ko samajhne ke liye, humein iske trend reversal ke liye key price levels ko dekhna hota hai. Agar price action key resistance levels ko cross karney lagta hai, to yeh bullish trend ki sorat mein aur zyada majboot hota hai. 5. Rounding Bottom Candlestick ki Istemaal: Rounding Bottom Candlestick pattern ko Forex trading mein istemaal karne ke liye, humein market ki technical analysis ke saath doosre technical indicators ka istemaal karna hota hai. Moving Averages, Fibonacci Retracement aur Relative Strength Index (RSI) jaisi indicators Rounding Bottom Candlestick pattern ke saath istemaal kiye jatey hain. 6- Trading Strategy Of Rounding Bottom In Forex Trading : Rounding Bottom Candlestick ek bullish reversal pattern hai jo forex trading mein use kiya jata hai. Ye pattern aksar long term timeframes jaise ki weekly aur monthly charts par dekha jata hai. Ye pattern ki formation ke liye kuch steps ko follow karna hota hai. Step 1: Sabse pehle, stock ya currency pair ki trend ko determine karna zaroori hai. Agar trend pehle se bearish hai to ye pattern useful nahi hoga. Step 2: Next step hai ki chart par price action ki analysis karna. Is pattern ki formation ke liye 2-3 months ke data ki zaroorat padti hai. Is pattern ki formation mein 10-20 candles ka time lagta hai. Step 3: Ab ek U-shaped curve banane ke liye price action ki movement ko dekhna hoga. Price action jaise ki support level ke around trading karta hai, jahan se uska price ek U-shaped pattern banata hai. Jab price action yahan se upper level par jaata hai to ye pattern complete ho jaata hai. Step 4: Jab price action ne upper level par jaane ke baad ek bar dip kar liya hai to aap long position ko enter kar sakte hain. Entry point ko upper level par determine kar sakte hain. Step 5: Stop loss ko lower level par set karna zaroori hai jis se ki agar trend reversal ho jaaye to aapka loss kam ho sake. Step 6: Take profit level ko upper level ke around set karna zaroori hai jahan se aapko lagta hai ki price action upper level par phir se resistance ko test karega. Ye tha Rounding Bottom Candlestick pattern ka trading strategy forex trading mein Roman Urdu mein. Shape: Rounding Bottom Candlestick pattern "U" ki tarah hota hai, jo bearish trend k baad form hota hai. Is pattern mein, price initially down move karta hai aur phir aik long-term base create karta hai. Jab price is base se up move karta hai, tab bullish trend ki starting hojati hai. Is pattern ki sahi samajh k liye, traders ko volume aur moving averages ko bhi dekhna chahiye. Moving Average: Moving averages, trading k liye boht important hotay hain aur Rounding Bottom Candlestick chart pattern k sath bhi inka use karna chahiye. Jab traders price ki trend direction determine karte hain, to moving averages ki help se unhein trend direction ka andaza lagaya ja sakta hai. Rounding Bottom Candlestick pattern ki sahi samajh k liye, traders ko 50-day aur 200-day moving averages ko consider karna chahiye. Volume: Volume, Rounding Bottom Candlestick chart pattern k liye bhi boht important hai. Jab yeh pattern form hota hai, to volume ki increase ki ummed hoti hai. Jab price U-shaped pattern ki completion karega, to volume k sath price ki upward movement bhi hojani chahiye. Isliye traders ko volume ki observation karna chahiye, kyun k iska increase bullish trend ki starting ko indicate karta hai. Risk Management: Risk management, trading k liye boht important hota hai. Rounding Bottom Candlestick chart pattern ki trade karte waqt, traders ko apni risk management strategy ko follow karna chahiye. Stop loss order ko sahi jagah set karna chahiye taa k loss ko minimize kiya ja sakay. Is pattern ki trade mein, traders ko apni risk tolerance ko samajhna chahiye aur apni trade ko carefully monitor karna chahiye. Conclusion : In saray points ko maddey nazar rakhte huey, Rounding Bottom Candlestick pattern ek bullish reversal pattern hai, jis ki madad se hum Forex trading mein market trend ki analysis aur trading ke liye helpful signals hasil kar sakte hain.

      اب آن لائن

      Working...
      X