Assalamu Alaikum
Dear forex member ummid krti hain sub kharyt sy hn gy or mahnat say apna work krrhy hn gy hmy kamyabi Hasil krny k ly mahnt sy kam krna hota h hmy weekly bounce k ly hmy achi post share krni chaye jitni achi post ho gi itna hi hm kamyab ho skty hai hmra aj topic hai elder ray index ko discuss krna hai es p study kr k hm apna knowledge gain kr skty hsi achy knowledge p ji hmy acha bounce hasil hoga
Introduction
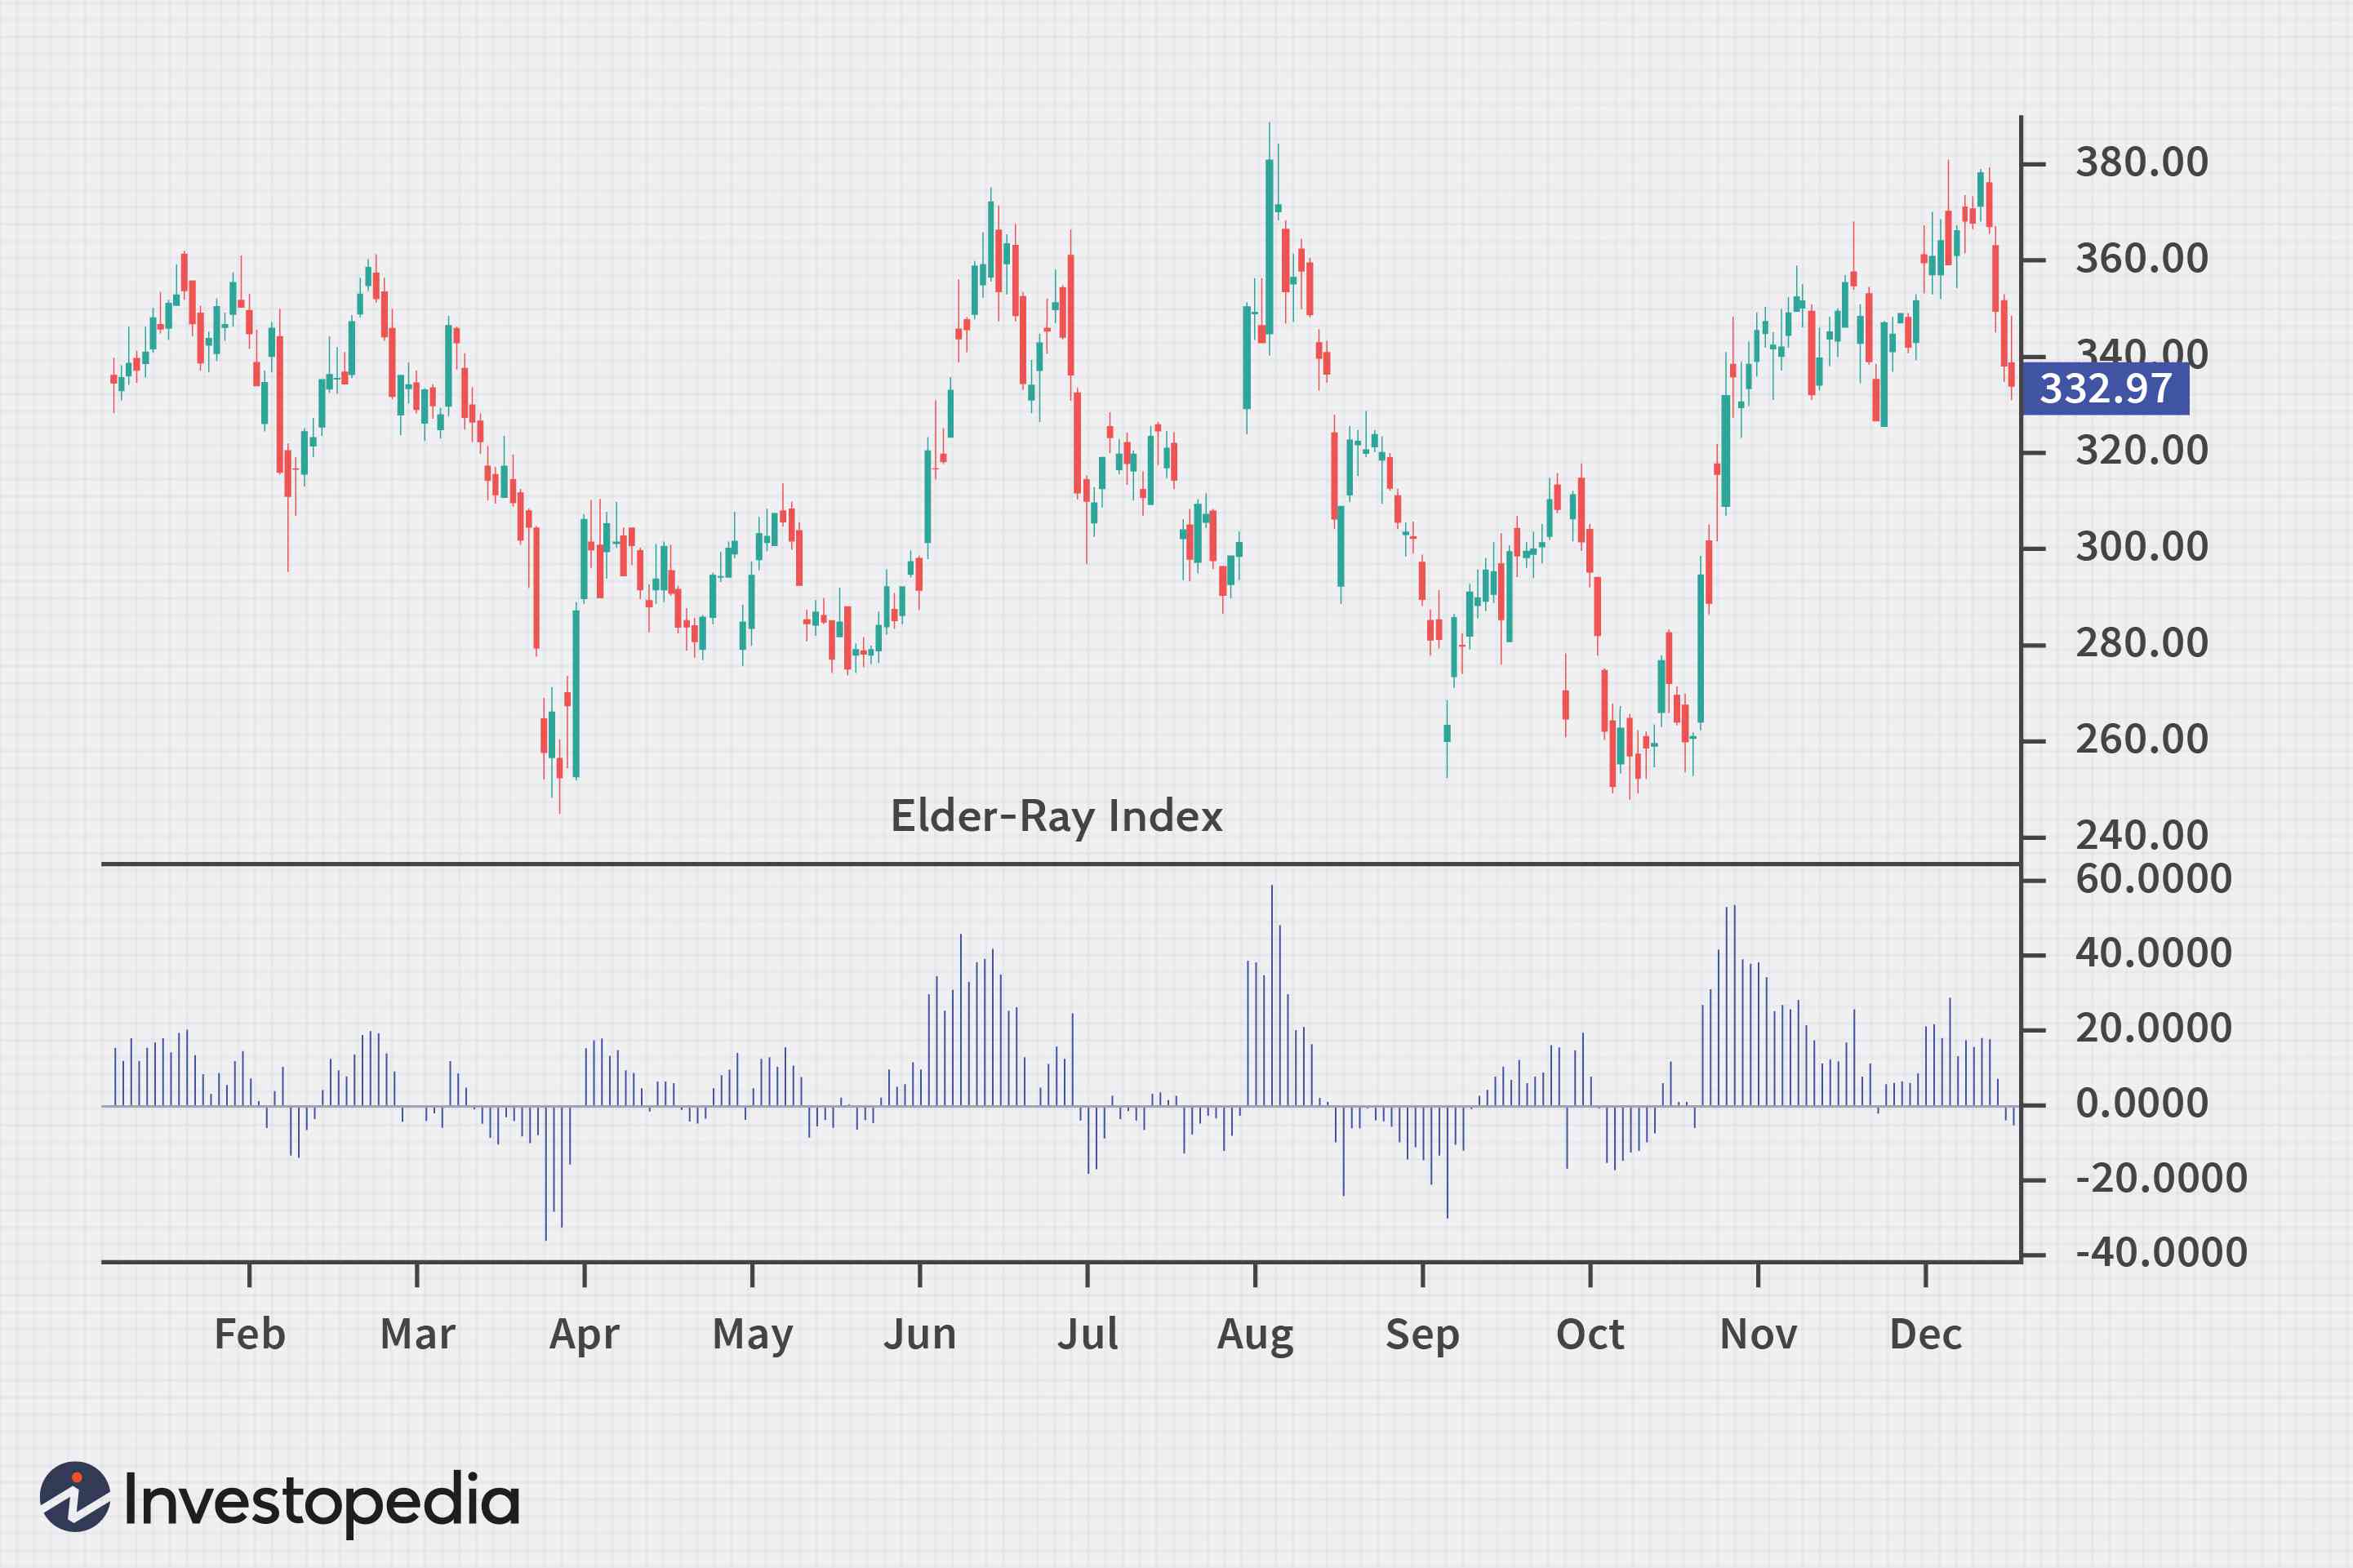
Forex marjet main trading kay liye buying and selling pressure jan'ny kay liye traders is indicator ka use karty hain. Is indicator kay do components hain yani bulls power and bears power aur iski calculations kay liye ham exponential moving average ka use karty hain.forex market me elder ray index indicator ek most important Indicator ha forex makret me jo k buying d selling k pressure ko measure krta ha. R isko market me desgn kia gya ha. R ye buying r selling ko find krny k ly r ye bullish r bearish k components me b km krta ha. Is Indicator ko bullish r bearish k name se b identify kia ja skta ha. R isky period ko exponential k moving average k relation se show kia jta ha...
Importants
forex market me jesy. K apko pta h k ye Indicator buying d selling k pressure ko measure krta ha. Is Indicator k two components hoty hn. Jo k bullish power f bearish power. To is ly humy trade k doran ye b mind b rkhna chahiye k jb bum isky all components ko use krty hn to humy isky Exponential Moving Average ko some rkhna chahiye. R is Indicator ko hum small timeframe me use kr skty hn. To ye bt humy mind b rkhni zaruri ha k isko hum short timeframe me ue kr skty hn.

Forex market main trading kay liye buying and selling pressure jan'ny kay liye traders is indicator ka use karty hain. Is indicator kay do components hain yani bulls power and bears power aur iski calculations kay liye ham exponential moving average ka use karty hain.
Bullish pressure
Market main bulls kay control ko measure karny kay liye EMA ko price main say minus karty hain.
Bears pressure
EMA say stock ki lowest price ko subtract karny say bears power ka pata lagaya jata hay.
Treading strategy
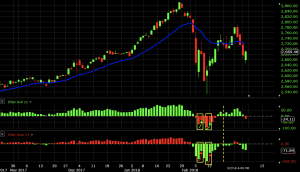
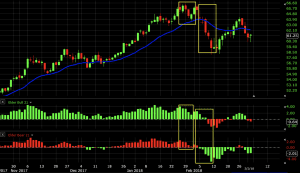
indicator main hamain 13 period EMA ko base banana parta hay. Jab market kay lower kow main bear power higher low banayain, yani bear power aur price main divergence a jaye to ye buy ka signal hoga, jab keh ager market kay higher highs main bull power lower highs banay yani bull power indicator aur price kay darmian bearish divergence banay to ye strong sell ka signal hota hay.
Buy main trading kay liye ham daikhain keh ager EMA slop up nazar aye aur price EMA say above ho, aur bear power bar previous bar say higher ho to buy main trade open karain.
Isi tarah sell ki trade main, price EMA say kam hi, EMA slope don ho aur bull power decreasing main ho yani bull power bar previous bar say below ho to sell ka order place kar lain.

Dear forex member ummid krti hain sub kharyt sy hn gy or mahnat say apna work krrhy hn gy hmy kamyabi Hasil krny k ly mahnt sy kam krna hota h hmy weekly bounce k ly hmy achi post share krni chaye jitni achi post ho gi itna hi hm kamyab ho skty hai hmra aj topic hai elder ray index ko discuss krna hai es p study kr k hm apna knowledge gain kr skty hsi achy knowledge p ji hmy acha bounce hasil hoga
Introduction
Forex marjet main trading kay liye buying and selling pressure jan'ny kay liye traders is indicator ka use karty hain. Is indicator kay do components hain yani bulls power and bears power aur iski calculations kay liye ham exponential moving average ka use karty hain.forex market me elder ray index indicator ek most important Indicator ha forex makret me jo k buying d selling k pressure ko measure krta ha. R isko market me desgn kia gya ha. R ye buying r selling ko find krny k ly r ye bullish r bearish k components me b km krta ha. Is Indicator ko bullish r bearish k name se b identify kia ja skta ha. R isky period ko exponential k moving average k relation se show kia jta ha...
Importants
forex market me jesy. K apko pta h k ye Indicator buying d selling k pressure ko measure krta ha. Is Indicator k two components hoty hn. Jo k bullish power f bearish power. To is ly humy trade k doran ye b mind b rkhna chahiye k jb bum isky all components ko use krty hn to humy isky Exponential Moving Average ko some rkhna chahiye. R is Indicator ko hum small timeframe me use kr skty hn. To ye bt humy mind b rkhni zaruri ha k isko hum short timeframe me ue kr skty hn.
Forex market main trading kay liye buying and selling pressure jan'ny kay liye traders is indicator ka use karty hain. Is indicator kay do components hain yani bulls power and bears power aur iski calculations kay liye ham exponential moving average ka use karty hain.
Bullish pressure
Market main bulls kay control ko measure karny kay liye EMA ko price main say minus karty hain.
Bears pressure
EMA say stock ki lowest price ko subtract karny say bears power ka pata lagaya jata hay.
Treading strategy
indicator main hamain 13 period EMA ko base banana parta hay. Jab market kay lower kow main bear power higher low banayain, yani bear power aur price main divergence a jaye to ye buy ka signal hoga, jab keh ager market kay higher highs main bull power lower highs banay yani bull power indicator aur price kay darmian bearish divergence banay to ye strong sell ka signal hota hay.
Buy main trading kay liye ham daikhain keh ager EMA slop up nazar aye aur price EMA say above ho, aur bear power bar previous bar say higher ho to buy main trade open karain.
Isi tarah sell ki trade main, price EMA say kam hi, EMA slope don ho aur bull power decreasing main ho yani bull power bar previous bar say below ho to sell ka order place kar lain.


تبصرہ
Расширенный режим Обычный режим