Harmonic Price Chart patterns
Harmonic*price*chart*patterns ko define karne ke liye aapko Hamesha step-wise market ki movement ko dekhna padta hai aur market ke trend ko follow karte hue apni trade ko perform karne ke bare mein strategy banani padati hai basically harmonium price indicator hmain hameshaa price level ko dkhty howe he samajhna parta hai to jb bhi ap*harmonic*price*chart*pattern*ko smghne ki koshish krte hain aur is k method py kam krty hain to aapko sab sy phla step lena hota Hai yeh price ke bary mn lena hota hai ki hmain candlestick ki help sy market price ko dekhty howe potential difference dekhna parta hai price level ke difference ko bhi judge kr lety hain to Us k bad baki step ko follow krna hmary liye bhut easy ho gata hai

Definition of Harmonic Price Chart
Harmonic*price*chart*pattern*technically market ka*pattern*hai hai aur hamen isko jarur analyse karna chahie jab Ham market ke technical analysis karenge to tab hi ham market ko samajh sakenge aur tab hi ham*harmonic*pattern*ko analyse karke market mein working kar sakenge agar Ham market mein*harmonic*pattern*ko theek tariky se analize nahi karte Hain to hmn success nahin Mil sakti hai is liye hmain market mn harmonic*pattern*ko analyse krna bhut zarori hai jab market mn Ham technically analyzers krte hn to tab hm market mein*harmonic*pattern*ko use karke market se bahut hi good amount mn profit hasil kar sakte hain*harmonic*pattern*market mn kafi importance rkhty hain aur agar hm is to theek tariky se use ghair lain to Ham market se kafi acha profit hasil kar sakte hain

Explanation
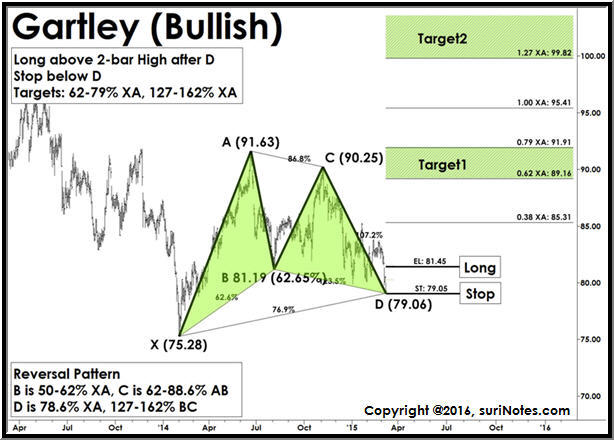
Harmonic*price*pattern*aik candlestick kay combination say he banny wala*pattern*hay jis main ham 4 level ka volume aur movement daikhty hain. Yani keh aik range jo bearish ho, second jab bullish ho aur third again bearish, jab k forth ki ham prediction per trade karty hain. Is mn first bullish movemet aur second bullish movement ager same ho aur inki last candles bhi same body per hon to he hm ik bullish trend assume kr skty hain ur is mn trade kar sakty hain. Harmonic*price*pattern*time aur price movement per mushtamil hota hay jo hmain fibonacci ratios, retracement and market extensions k sath turning points ka btata hay. Fibonacci ratio kisi bhi market aur time frames mn bhut useful aur possible hai
Trading
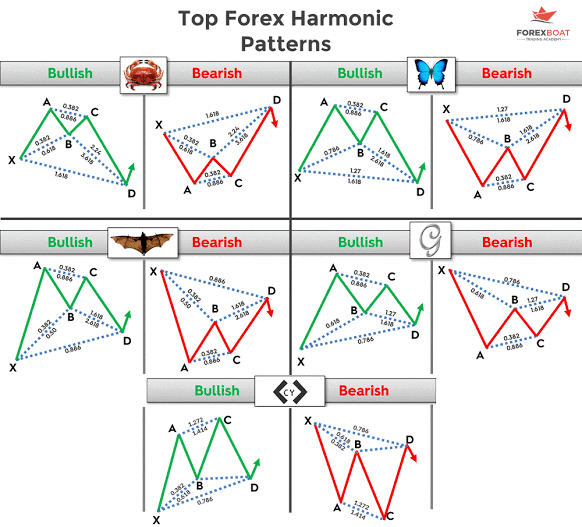
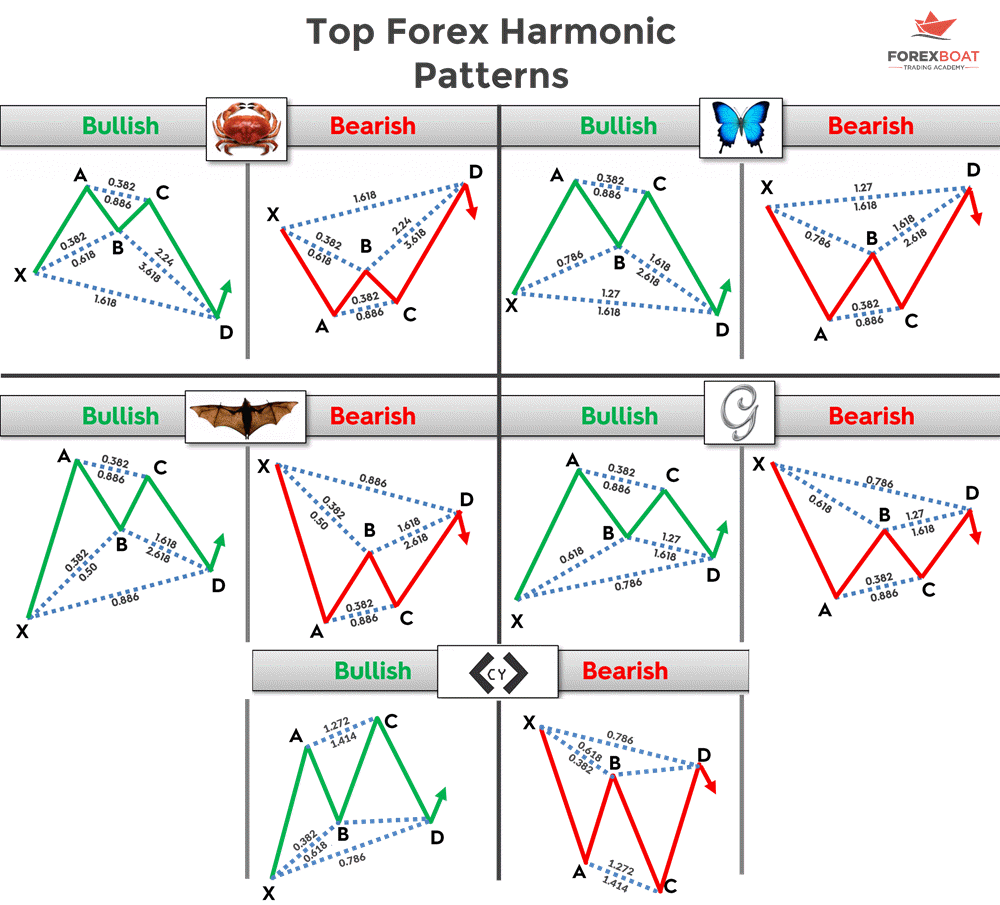
Harmonic*pattern*asy*pattern*hoty hain jo*harmonic*phenomena use karty hain. Eska matlab hai k enko mazeed smaller or larget waves ma divide kiya ja sakta hai. Ye division market price ko predict karny k lae use kaye jaty hain.*Harmonic*pattern*fabonacci number par munhasir hoti hai. Jin ko technical ki creation ma usw kiya jata hai. Fabonacci number asy number hoty hain jo 0 or 1 sy start hoty hai or next number asy hasil hota hai agr ham previous 2 ko add kaye jae. Ye sequence ratio ma break kiya ja sakta hai or enko use kar k market k bary ma clues find kaye k market kis side par ja sakti hai. Gatrely, bat or carn bhot famous*harmonic*patterns hain

Harmonic*price*chart*patterns ko define karne ke liye aapko Hamesha step-wise market ki movement ko dekhna padta hai aur market ke trend ko follow karte hue apni trade ko perform karne ke bare mein strategy banani padati hai basically harmonium price indicator hmain hameshaa price level ko dkhty howe he samajhna parta hai to jb bhi ap*harmonic*price*chart*pattern*ko smghne ki koshish krte hain aur is k method py kam krty hain to aapko sab sy phla step lena hota Hai yeh price ke bary mn lena hota hai ki hmain candlestick ki help sy market price ko dekhty howe potential difference dekhna parta hai price level ke difference ko bhi judge kr lety hain to Us k bad baki step ko follow krna hmary liye bhut easy ho gata hai
Definition of Harmonic Price Chart
Harmonic*price*chart*pattern*technically market ka*pattern*hai hai aur hamen isko jarur analyse karna chahie jab Ham market ke technical analysis karenge to tab hi ham market ko samajh sakenge aur tab hi ham*harmonic*pattern*ko analyse karke market mein working kar sakenge agar Ham market mein*harmonic*pattern*ko theek tariky se analize nahi karte Hain to hmn success nahin Mil sakti hai is liye hmain market mn harmonic*pattern*ko analyse krna bhut zarori hai jab market mn Ham technically analyzers krte hn to tab hm market mein*harmonic*pattern*ko use karke market se bahut hi good amount mn profit hasil kar sakte hain*harmonic*pattern*market mn kafi importance rkhty hain aur agar hm is to theek tariky se use ghair lain to Ham market se kafi acha profit hasil kar sakte hain
Explanation
Harmonic*price*pattern*aik candlestick kay combination say he banny wala*pattern*hay jis main ham 4 level ka volume aur movement daikhty hain. Yani keh aik range jo bearish ho, second jab bullish ho aur third again bearish, jab k forth ki ham prediction per trade karty hain. Is mn first bullish movemet aur second bullish movement ager same ho aur inki last candles bhi same body per hon to he hm ik bullish trend assume kr skty hain ur is mn trade kar sakty hain. Harmonic*price*pattern*time aur price movement per mushtamil hota hay jo hmain fibonacci ratios, retracement and market extensions k sath turning points ka btata hay. Fibonacci ratio kisi bhi market aur time frames mn bhut useful aur possible hai
Trading
Harmonic*pattern*asy*pattern*hoty hain jo*harmonic*phenomena use karty hain. Eska matlab hai k enko mazeed smaller or larget waves ma divide kiya ja sakta hai. Ye division market price ko predict karny k lae use kaye jaty hain.*Harmonic*pattern*fabonacci number par munhasir hoti hai. Jin ko technical ki creation ma usw kiya jata hai. Fabonacci number asy number hoty hain jo 0 or 1 sy start hoty hai or next number asy hasil hota hai agr ham previous 2 ko add kaye jae. Ye sequence ratio ma break kiya ja sakta hai or enko use kar k market k bary ma clues find kaye k market kis side par ja sakti hai. Gatrely, bat or carn bhot famous*harmonic*patterns hain
تبصرہ
Расширенный режим Обычный режим