cad/jpy
No announcement yet.
X
  • وقت
  • دکھائیں
Clear All
new posts
  • #61 Collapse

    Re: cad/jpy

    Click image for larger version

Name:	CADJPYH4.png
Views:	1
Size:	30.5 کلوبائٹ
ID:	12339094
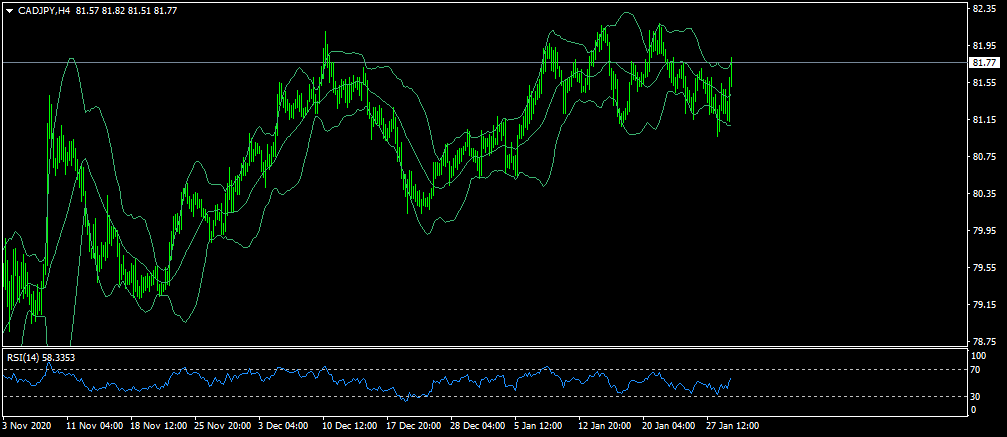
    CAD/JPY ki qeemat is waqt 81.77 hai, 4H chart ke mutabiq is ka up trend hai aur ye is ko continue rakh sakta per jese ke price bollinger band ke uper wale band ko touch kar rahi hai aur ye kuch ziyada hi buy ho chuka hai aur abhi mazeed uper jana band kar sakta hai lihaza jinho ne CAD/JPY ko buy kia hua hai wo muhtat ho jae aur apni trades ka khayal rakhe.
       
    • <a href="https://www.instaforex.org/ru/?x=ruforum">InstaForex</a>
    • #62 Collapse

      Re: cad/jpy

      Click image for larger version

Name:	CADJPYH4.png
Views:	1
Size:	31.4 کلوبائٹ
ID:	12339159
      CAD/JPY ki qeemat is waqt 82.20 hai, 4H chart ke mutabiq is ka up trend hai aur ye is ko continue rakh sakta per jese ke price bollinger band ke uper wale band ko touch kar rahi hai aur ye kuch ziyada hi buy ho chuka hai aur abhi mazeed uper jana band kar sakta hai lihaza jinho ne CAD/JPY ko buy kia hua hai wo muhtat ho jae aur apni trades ka khayal rakhe.
         
      • #63 Collapse

        Re: cad/jpy

        Click image for larger version

Name:	CADJPYH4.png
Views:	1
Size:	30.9 کلوبائٹ
ID:	12339289
        CAD/JPY ki qeemat is waqt 82.64 hai, 4H chart ke mutabiq is ka up trend hai aur ye is ko continue rakh sakta per jese ke price bollinger band ke uper wale band ko touch kar rahi hai aur ye kuch ziyada hi buy ho chuka hai aur abhi mazeed uper jana band kar sakta hai lihaza jinho ne CAD/JPY ko buy kia hua hai wo muhtat ho jae aur apni trades ka khayal rakhe.
         
        • #64 Collapse

          Good evening All user cad/Jpy Today Martket technical Analysis Indicator shows market going down and technical Analysis same thing Es liye me app ko technical analysis or indicator ko follow karte howey bata raha hon ke market ajj {73% Buying} me hai cadjpy 3 January ko 76. 60 ke do saal ki kam se kam ke baad 89. 25 se 76. 60 ke qareeb 84. 40 ke qareeb 61.6 % fibco return ki satah aur 76. 65ke andar andar chal raha hai. darmiyani muddat mein, jori aik neechay lachak dar line se neechay reh gaya hai, kuch had tak bardasht dhancha ka mahswara .CAD/JPY ki qeemat is waqt 81.72 hai, 4H chart ke mutabiq is ka up trend hai aur ye is ko continue rakh sakta per jese ke price bollinger band ke uper wale band ko touch kar rahi hai aur ye kuch ziyada hi buy ho chuka hai aur abhi mazeed uper jana band kar sakta hai lihaza jinho ne CAD/JPY ko buy kia hua hai wo muhtat ho jae aur apni trades ka khayal rakhe. qeemat bollinger ke nichale hissay par trading aur qeemat mein izafay ki imkaan ziyada hai mazboot muzahmat ki satah 84. 00 hai kamzoree ki himayat ki satah 82. 40 hai mazboot himayat ki satah 81. 00 hai rujhan agay barha hai aur hum is ke andar andar agay barh jayen ge . misbet dabao ki soorat mein market 83. 96 khittay mein aur phir 84. 40 ki 61. 8Ùª mein muzahmat ko poora karsaktha hai, jabkay ziyada se ziyada hisson mein taiz taasub ki tarweej kere gi, oopri bolinger baind ke oopri baind ko khatam kar di jaye gi. aglay satah 86. 25 rukawat se pehlay 85. 25 rukawat se aa raha hai
          • #65 Collapse

            CAD/JPY Time Chart: Outlook and Analysis: CAD/JPY Time Chart, Canadian Dollar aur Japanese Yen ke darmiyan tajweezat aur tabdeeliyon ka khaka hai. Yeh time chart, Forex aur trading professionals ke liye ahem maqasid ka halqa hai, jahan unhein aam taur par saal, mahina, hafta ya rozana ki bunyad par CAD/JPY exchange rate ki tashkeel, tarjumani aur soochi pradarshan ki sahulat milti hai. Is time chart ki madad se, traders CAD/JPY ke muashiyat aur trends ko samajh sakte hain, jo unhein trading ke faislon ke liye munasib maalumat faraham karte hain.CAD/JPY Time Chart ki Outlook, mukhtasar tareeqay se, CAD/JPY currency pair ke future performance ki tashkeel hai. Is Outlook ka maqsad CAD/JPY ke exchange rate ki khabar, analysis aur forecasts ke zariye traders ko trading strategies aur decisions ke liye madad faraham karna hai. Outlook, CAD/JPY ke muddaton aur aam taur par yakeeni masroofiyat aur samaji rawayat ke asar par tawajjuh deti hai. Is tashkeel mein CAD/JPY ke muashiyat, economic indicators, policy decisions, aur global events ke asrat shamil hote hain.CAD/JPY Time Chart ka Overview CAD/JPY currency pair ke nazariye, history aur halqa-e-khana ka ek jayeza faraham karta hai. Overview ki madad se traders, CAD/JPY ke exchange rate ke baray mein mukammal sochtein aur insights hasil kar sakte hain. Overview mein CAD/JPY ki tareekhi performance, trend analysis, volatility, aur notable price levels shamil hote hain. Yeh ek comprehensive analysis hai, jis mein past data aur trends ke zariye CAD/JPY ki behaviour aur future expectations ko samjha jata hai. Understanding CAD/JPY Time Chart: Overview and Key Insights: CAD/JPY Time Chart ki ahmiyat ki roshni mein, traders aur investors ko CAD/JPY currency pair ki mukammal samajh aur uski performance ki roshni mein trading strategies tayyar karne ka mauqa milta hai. Yeh time chart, technical aur fundamental analysis ki tajweezat ko jama karke, CAD/JPY ke rate fluctuations aur price movements ko map karne mein madadgar hota hai. Outlook aur Overview dono traders ko market ke mukhtalif pahluon par tawajjuh dilane mein madad dete hain, jaise economic indicators, central bank policies, aur geopolitical events.CAD/JPY Time Chart ke zariye traders apne trading decisions ko better informed banate hain. Yeh chart unhein CAD/JPY ke exchange rate ke patterns, support aur resistance levels, aur trend reversals ke baray mein achi malumat faraham karta hai. Overview ke zariye, traders CAD/JPY ke historical data par tawajjuh dete hain, jis se unko CAD/JPY ke future movements aur potential trading opportunities ka andaza hota hai.Sametay hue, CAD/JPY Time Chart par tawajjuh dena sirf ek tarz-e-zindagi ya recommendations ka zariya nahi hai. Traders ko hamesha apne tajziati mizaj aur research par bharosa rakhna chahiye aur apne trading decisions ko risk management aur apni financial capacity ke sath tayyar karna chahiye. Yeh sirf market ki nazron aur CAD/JPY currency pair ki movements ke baray mein aik achi samajh pradan karta hai, lekin akhri faislon ka zimmedar trader khud hota hai.
            • #66 Collapse

              CAD/JPY ANALYSIS AT 1 HOUR TIME FRAME : Cad/jpy ki jo price ha one hour ka time frame par wo higher ke janab move karti hoi ja rahi ha ha or is cad/jpy ka jo one hour wala chart frame ha is ma jo resistance level ha ya high ma 109.18 par ha or is cad/kpy ki jo price ha ya high ke traf ja rahi ha or agar is cad/jpy ki price high ma jata hua higher ma jo resistance level ha 109.18 ka is level ko agar is cad/jpy ki one hour ke candle ja kar hit karti ha or is 109.18 ka resistance level sa lower ma agar is cad/jpy ki one hour ke candle close hoti ha to traders is cad/jpy ma sell ke janab ki trade ko enter karay ga or agar is cad/jpy ki price higher ma resistance level ke janab ni jati or lower ma support level ke traf ati ha jo ka support level lower ma 108.18 par ha or is cad/jpy ki one hour ke candle ja kar is lower ma jo support level ha 108.18 ka support level ko hit karti ha or ya cad/jpy ki one hour ke candle is support level 108.18 ka support level sa high ma close hoti ha to traders is ma buy ke trade ko enter karay ga. CAD/JPY ANALYSIS AT 4 HOURS TIME FRAME : Cad/jpy ko four hours ka time frame par analysis karay to is cad/jpy ki jo price ha ya uptrend ko banata hua higher ke janab is cad/jpy ki price ko la kar ja raha ha or is cad/jpy ki jo price ha ya higher ke janab is trha sa continue hoti hoi higher ma jo resistance level ha os par jati ha jo ka resistance level 109.42 ka is resistance level ko agar is cad/jpy ki jo fohr hours ke candel ha ya ja kar hit karti ha to traders ko is cad/jpy ki price ka downward ke janab reversal ho kar ana ka signal mila ga or trader is ma reverse ki yani sell ke janab ki trade ko enter karay ga or agar is cad/jpy ku price resistance level 109.42 tak ni jati ot phalay sa hi reversal ho jati ha or downward ma jo support level ha 107.42 ka is support level par jati ha or is 107.42 ka support level ko is cad/jpy ki one hour ke candle hit oarna ka bad is support level sa high ma hi close ho jati ha to traders is cad/jpy ma buy ke trade ko enter karay ga.
               
              • #67 Collapse

                CAD/JPY Time Chart: Outlook and Analysis: Time chart for the Canadian Dollar and the Japanese Yen; tajweezat and tabdeeliyon have equal value. Yeh time chart, Forex, and trading specialists are considered to be of the highest calibre. Jahan unhein aam taur par saal, mahina, hafta, and rozana are considered to be of the highest calibre. Trading ke faislon ke liye munasib maalumat faraham karte hain, is time chart ki madad se, traders CAD/JPY ke muashiyat aur trends ko samajh sakte hain.The CAD/JPY Time Chart's Outlook shows what the currency pair's future performance will be like. Is Outlook's analysis and forecasts of the CAD/JPY exchange rate relevant? If so, what impact will they have on traders' trading decisions and strategies? Aam taur par yakeeni masroofiyat and samaji rawayat ke asar par tawajjuh deti hai, outlook, CAD/JPY ke muddaton aur aam taur par tawajjuh deti hai. Economic data, political choices, and world events all have an impact on the CAD/JPY exchange rate.CAD/JPY Time Chart ka Overview, history, and halqa-e-khana ka ek jayeza faraham karta hai. traders, mukammal sochtein aur insights hasil kar sakte hain CAD/JPY ke exchange rate ke baray mein. Summary mein performance, trend analysis, volatility, aur notable price levels of CAD/JPY ki tareekhi hote hain. It's a thorough study because it considers both current behaviour and expected future behaviour for the CAD/JPY pair based on historical data and trends. CAD/JPY ANALYSIS AT 4 HOURS TIME FRAME : Using the CAD/JPY Time Chart's ahmiyat as a guide, traders and investors can analyse the performance of their trading techniques as well as the CAD/JPY currency pair as a whole. Yeh time chart, technical analysis, and fundamental analysis are all in agreement that the changes in the CAD/JPY exchange rate and price movements are what should be considered when drawing a map. Market traders' outlook and overview should take economic statistics, central bank policies, and geopolitical developments into account.Traders may make better-informed decisions thanks to the CAD/JPY Time Chart. You can find patterns, levels of support and resistance, and trend reversals on the chart for the CAD/JPY currency rate. Using historical data, traders may predict future fluctuations of the Canadian dollar and the Japanese yen as well as prospective trading opportunities.Similarly, the CAD/JPY Time Chart's suggestions and forecasts are not valid at this time. A trader's decision should be based on risk management, financial capacity, and the results of study they have conducted, according to traders. Yeh sirf market ki nazron ke baray mein aik achi samajh pradan karta hai, whereas akhri faislon ka zimmedar trader khud hota hai.
                • #68 Collapse

                  CAD/JPY Time Chart: Outlook and Analysis: Canadian Dollar and Japanese Yen exchange rates are shown in the CAD/JPY Time Chart. Yeh time chart, Forex, and trading specialists are considered to be of the highest caliber. Jahan unhein aam taur par saal, mahina, hafta, and rozana are considered to be of the highest caliber. Trading ke faislon ke liye munasib maalumat faraham karte hain, is time chart ki madad se, traders CAD/JPY ke muashiyat aur trends ko samajh sakte hain.The CAD/JPY Time Chart's Outlook shows what the currency pair's future performance will be like. Is Outlook's analysis and projections of the CAD/JPY exchange rate relevant? If so, what impact will they have on traders' trading decisions and strategies? Aam taur par yakeeni masroofiyat and samaji rawayat ke asar par tawajjuh deti hai, outlook, CAD/JPY ke muddaton aur aam taur par tawajjuh deti hai. Economic data, political choices, and world events all have an impact on the CAD/JPY exchange rate.Overview of the CAD/JPY time chart, historical background, and current exchange rate are all provided. traders, mukammal sochtein aur insights hasil kar sakte hain CAD/JPY ke exchange rate ke baray mein. Summary mein performance, trend analysis, volatility, aur significant price levels of CAD/JPY ki tareekhi hote hain. It's a thorough study since it considers both current behavior and expected future behavior for the CAD/JPY pair based on historical data and trends. Understanding CAD/JPY Time Chart: Overview and Key Insights: Using the CAD/JPY Time Chart's ahmiyat as a guide, traders and investors may analyze the success of their trading techniques as well as the CAD/JPY currency pair as a whole. Yeh time chart, technical analysis, and fundamental analysis have all been combined to produce the CAD/JPY rate variations and price movements that are being discussed here. Market traders' outlook and overview should take economic statistics, central bank policies, and geopolitical developments into account.Traders may make better-informed decisions thanks to the CAD/JPY Time Chart. You can find patterns, levels of support and resistance, and trend reversals on the chart for the CAD/JPY currency rate. Using historical data, traders may predict future fluctuations of the Canadian dollar and the Japanese yen as well as prospective trading opportunities.Similarly, the CAD/JPY Time Chart's suggestions and forecasts are not valid at this time. A trader's decision should be based on risk management, financial capability, and the results of study they have conducted, according to traders. Yeh sirf market ki nazron ke baray mein aik achi samajh pradan karta hai, whereas akhri faislon ka zimmedar trader khud hota hai.
                  • #69 Collapse

                    CAD/JPY ANALYSIS AT 1 HOUR TIME FRAME : Cad/jpy ko one hour ka time frame par analysis karay to is cad/jly ki jo price ha one hour ka time frame par ya downward ke janab move karti hoi ja rahi ha or is time par jo is cad/jpy ki price ha ya high ma uptrend ko rejected kar ka lower ke traf ja rahi hs or is cad/jpy ko one hour ka time frame par dakhs to is ma jo is time par cad/jpy ki price move kar rahi ha ya 108.34 par ha or is cad jpy ki price agar isi trha sa lower ke traf move karti hoi jati ha or lower ma jo ya support level ha is cad jpy ka one hour ka time frame par ya lower ma 107.80 par ha or is cad jpy ki one hour ke candle lower ma is 107.80 ka level ko hit kar ka is level sa high ma agar cad jpy ki one hour ke candle close hoti ha to traders ko is cad jpy ki price ka upwards jana ka signal mila ga or traders buy ke trade ko enter karay ga or agar is cad jpy ki price high ke janab reversal ho kar jata ha or high ma jo resistance level ha is cad jpy ka one hour ka time frame 108.52 par ha or is cad jpy ki price agar high ke trac reversal ho kar jati ha or high ma jo resistance level ha 108.52 ka is level ko agar cad jpy ki pne hour ke candle is 108.52 ka level sa lower ma close hoti ha to traders is cad jpy ma sell ke janab ki trade ko enter karay ga. CAD/JPY ANALYSIS AT FOUR HOURS TIME FRAME : Four hours time frame par is cad jpy ko analysis kiya jay to is four hours wala time frame par analysis karay to is cad jpy ki jo price ha ya resistance or support level ma middle ma move kar rahi ha cad jpy ka four hours ka time frame par is cad jpy ka four hours ka time frame par jo resistance level ha ya high ma 109.10 par ha or is cad jpy ki jo price ha four hours ka time frame par high ke janab move kar ka jati ha or jo cad jpy ki four hours ki candle is 109.10 ka resistance level sa down ma close hoti ha to traders is ma sell ke trade ko enter karay ga or agar is cad jpy ki price low ke traf move kar ka jati ha or lower ma is cad jpy ka jo support level ha 107.53 ka is support level par agar cad jpy ki four jours ka time frame ma price jati ha or ya cad jpy ki four jours ke candel is 107.53 ka level ko hit kar ka is level sa high ma four hours ke candel close hoti ha to traders is cad jpy ma buy ke trade ko enter karay ga or ya jo buy ke trade ho ge is ka profit target long high ma place kiya jay ga. CAD/JPY ANALYSIS AT DAY TIME FRAME : Analysis karay is cad jpy ko day ka time frame par to jo is cad jpy ki price ha day ka time frame par is ma jo resistance level ha day wala te frame par ya 110.49 par ha or is day ka tile frame par jo is cad jpy ma support level ha ya 104.59 par ha or is cad jpy ki jo price ha ya upside ke janab move karti hoi ja rahi ha or is cad jpy ka day ka time frame par uptrend chal raha ha or is cad jpy ki price high ke traf continues hpta hua jati ha or high ma jo resistance level ha 110.49 ka is resistance level ko cad jpy ki day ke candel hit karti ha or ya day walai candle is 110.49 ka lrvel sa down ke traf close hoti ha cad jpy ki day ke candel to traders is ma sell ke trade ko enter karay ga or agar is cad jpy ki price lower ke traf reversal hota hua ato ha is cad jpy ka day ka time frame par or lower ma jo support level ha 104.59 ka is level ko agar cad jpy ki dayke candle hit karta hua is 104.59 ka level sa up ma close hoti ha to traders is ma buy ke long term trade ko enter karay ga. CAD/JPY ANALYSIS AT WEEK TIME FRAME : Is cad jpy ko week ka time frame par analysis karay to is cad jpy ki jo price ha week ka time frame par ya bhi high ke traf ia cad jpy ki price ko la ja rahi ha or is cad jpy ka week ka time frame par jo resistance level ha ya 112.04 par ha or is ma week ka time frame par jo support level ha ya 100.64 par ha or is cad jpy ki jo four hours ki price ha ya resistance or support level ka middle ma ha agar hum is cad jpy ko analysis karta ha or is ke jo week ke price ha ya high ke traf jati ha or high ma 112.04 ka level ko cad jpy ke week wali candle hit karti ha or ya week ke candel is 112.04 ka level sa down ma close hoti ha to is ma traders ko sell ke trade ko enter karna ka signal mila ga or trader long term sell ma entry la ga or agar is cad jpy ki price week ka time frame par down ke traf move karti hoi jati ha or lower ma jo is week ke candel ha cad jpy ki ya lower ma 100.64 ka level ko hit karti ha or ya cad jpy ki week ke candel is 100.64 ka level ko hit karna ka bad is level sa high ma ya week ke candel close hoti ha to is ma buy ke entry la ga traders.
                     
                    • <a href="https://www.instaforex.org/ru/?x=ruforum">InstaForex</a>
                    • #70 Collapse

                      CAD/JPY ANALYSIS AT 1 HOUR TIME FRAME : Cad/jpy ko among hour ka moment frame par analysis karay to is cad/jly ki jo price ha among hour ka time spent anchor the same level ya downward ke janab move karti hoi ja rahi hectare and is time a par jo is cad/jpy ki price ha ya high ma an upward trend ko rejected kar ka lower ke traf ja rahi hs or is cad/jpy ko one hour ka time frame par dakhs to is ma laughed is moment par cad/jpy ki price proceed kar rahi ha ya 108.34 par ha or is cad jpy ki price agar isi trha sa lower ke traf move karti hoi jati ha or smaller ma jo ya support level ha is cad jpy ka among moment ka time frame par you're in the lower students 107.80 par ha or is cad jpy ki one hourly rate ke candle lower ma is 107.80 ka level ko hit kar ka is level sa high ma agar in cad jpy ki one hour shared candle close hoti ha to traders ko is the two programs jpy ki price ka upwards jana ka signal mila ga or traders buy ke trade ko enter karay ga or agar is cad jpy ki the cost high ke janab reverse processing ho kar jata ha or high ma jo an inability to respond level ha is cad jpy ka one hour ka time frame 108.52 par ha or is cad jpy ki price the agar solution high ke trac reversal ho kar jati ha or excessive ma jo resistance level ha 108.52 ka is level ko agar cad jpy ki pne per hour. shared candle is 108.52 ka level sa lower ma close hoti ha to traders is cad jpy ma sell ke janab ki trade ko enter karay ga. CAD/JPY ANALYSIS AT WEEK TIME FRAME : Is cad jpy ko week ka time framework a par examination karay to has become cad jpy ki jo price ha a single week regarding ka the years frame the same level ya bhi large ke traf becomes cad jpy ki price ko la ja rahi ha or is cad jpy ka week ka time frame par jo resistance level ha ya 112.04 par ha or is ma week ka time frame par jo encouragement level ha ya 100.64 par ha or is cad jpy ki jo four hours ki price ha ya resistance or support level ka middle ma ha agar hum is CAD software jpy ko analysis karta ha or is ke jo week ke price ha ya high ke traf jati ha or high students 112.04 ka level ko cad jpy ke week wali candle hit karti ha or ya week ke candel is 112.04 ka level sa down ma close hoti ha to is ma traders ko sell ke trade ko integrate karna ka signal mila ga or trader long term sell ma admission la ga or agar is cad jpy ki price week ka time frame level ground downward ke traf advance karti hoi jati hectare or lower ma jo is week ke candel ha cad jpy ki ya lower ma 100.64 ka level ko hit karti ha or ya cad jpy ki week ke candel is 100.64 ka level ko hit karna ka bad is level sa high the student ya week ke candel close hoti ha to is ma buy ke entry la ga traders.

                      اب آن لائن

                      Working...
                      X