Silver
No announcement yet.
X
  • وقت
  • دکھائیں
Clear All
new posts
  • #46 Collapse

    Re: Silver

    Silver
    Respected members of Pakistan forum today market trend*
    Fundament or technical analysis to ajj market down janey ki terf eshara kar rahy hain or tamam indiactor be esi terf market ki postion ka bata rahain hain me app ko kuch indiactor ka bata raha hin jo market ki position ka bata rahay hain
    Rsi=88%=sell
    Moving avarage =56%=Sell
    Pivot point =72%=Sell
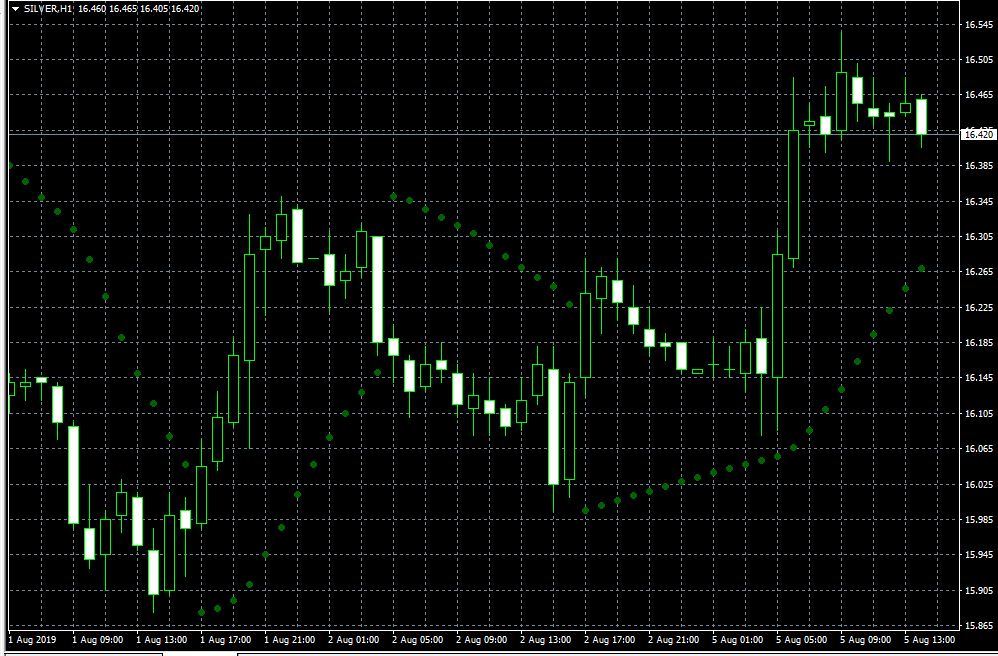
    Parabolic SAR =Sell*
    Tarde with money Managment
    Today trend =Sell
    Ap log is waqat sell men trade laga kr zyda
    Earring hassle kr saktay hen.

    Click image for larger version

Name:	Silver.png
Views:	1
Size:	19.0 کلوبائٹ
ID:	12322680
    • <a href="https://www.instaforex.org/ru/?x=ruforum">InstaForex</a>
    • #47 Collapse

      Re: Silver

      Silver
      AAaj aaj market ka trend Upar jaane ka Najar a raha hay. frame M 15 se movement Ki Jana ho rahi hai market ka trained niche ki tarf aa raha hay.
      Rate hay 17.455
      Ye or neechay ja Sakta hay .
      • #48 Collapse

        Re: Silver

        Amrici dollar mutawaqqa paidawar ki behtar qeematon par agay bherne ke baad billion kamzor ho gaya.

        barhti hui trained line ke neechay ke waqfay ne chandi ki baazyabi ko khatray mein daal diya hai. phir reechh ka 23.80 par tanqeedi himayat se neechay aana is baat ka ishara tha ke unhon ne baala dasti haasil kar li hai.

        ziyada farokht honay wala rsi mehdood uuchaal ka sabab ban sakta hai.

        belon ke paas 24.40 ke lag bhag paishkash uthany ka mushkil kaam hota hai taakay neechay ki janib taasub ko tabdeel kya jasakay. agar raftaar ke tajir is mein shaamil ho jatay hain to, farokht ka aik 40.2 aur phir nafsiati tag ko 23.00 par nishana bana sakta hai.


        Click image for larger version

Name:	silver.jpg
Views:	1
Size:	83.6 کلوبائٹ
ID:	12343264
         
        • #49 Collapse

          Re: Silver

          khazanay ki barhti hui pedawar aur Amrici dollar qeemti dhaton par wazan rakhtay hain. kuch saudey baz shikari 22.00 ki nafsiati satah par chandi kharidne ke shoqeen thay, jo ke rozana ki time frame se bhi ahem muawnat hai.

          taham, rebound ne 23.10 par mazboot farokht sood dekha hai. agar khredar azad honay ke liye kaafi raftaar jama karen to agla hadaf 23.80 hoga.

          manfi pehlu par, aik bearish break out aakhri kharidaron ko hila kar rakh day ga aur gayarah mah tak jari rehne wali mazbooti ko mandi ke ulat palat ke sath khatam kere ga.


          Click image for larger version

Name:	xauusd.jpg
Views:	1
Size:	82.5 کلوبائٹ
ID:	12344250
           
          • #50 Collapse

            Re: Silver

            Assalam alaikum dear members!
            umeed ha ap sb khair khairiat se hn gy or apka last trading week bahut acha gaya ho ga.
            dear members forex trading krty hovy agr hum market ko analyse kar k trade karen to hmari trading bhtr ho skti ha or hum profit gain kar skty hain.
            or es post ka maqsad b yahi ha k hm silver ko next week k lye analyse karen or possible support & resistance ko bhi dscs karen taa k hmari traing main help ho sky.
            es post main hum silver k differnt time frames k chart ka analysis karen gy.


            Weekly Chart Analysis:

            Dear members agr silver k weekly chart ko dekha jy to to hamen last week ki spinning top candlestick main closing dkhai deti ha or jahan se ye candle reverse ho k ai ha wo aik demand zone ha jo k 21.8 se 22.3 tk ka zone ha.
            es demand zone se past main bhi silver reverse ho chuka ha or abhi bhi silver esi demand zone main ha.
            expected yahi ha k silver next week yahan se bullish ho ga or es demand zone ko break nahi kary ga.

            Click image for larger version

Name:	31B92142-153B-4C78-990D-FD868366D814.jpeg
Views:	6
Size:	774.5 کلوبائٹ
ID:	12354724

            agr for example ye es demand zone ka bteakout bhi karta ha to nechy aik trendline ha jo k silver ko weekly chart main support kar rhi ha or silver es trend line py bht bar support le chuka ha to dekand zone k breakout k bad es supportibe trend line se silver support le k bullish ho skta ha laikin mera nahi khayal k ye mazeed bearish ho es trendline k nechy.


            daily Chart Analysis:

            dear members agr silver k daily k chart ko dekhen to friday ki candle aik doji close hovi ha or es k ilawa nechy hmary pas 21.494 ki support ha js se past main silver reverse ho chuka ha or ab yahan py double bottom bn raha ha.
            Next week k lye main silver ko weekly se or daily k chart main es double bottom se bullish dekh raha hn.
            laikin phr bhi agr ye nechy retracement leta ha to nechy ye 22 tk aa skta ha.

            Click image for larger version

Name:	99851A68-8ECF-447F-BCB0-F98BF574C445.jpeg
Views:	6
Size:	704.5 کلوبائٹ
ID:	12354730

            to agr hamen silver main trade leni ha to hamen 22$ ya ya es se nechy leni ha jb k hmara stop loss 21.4$ se bhi nechy hona chahye.

            technicals k ilawa bhi fundamentals bullish ka sign dy rahy hain jesa omicron virus aa raha ha to america ki economy down ho rhi ha ha jski waja se slver ki prices barh skti hain.

            Weekly support: $21.2 es week support k tor py kaam kary ga.


            Weekly resistance: $22.5 es week resistance k tor py kaam kary ga.
            THANK YOU GUYS ! :1f60a:
            • #51 Collapse

              Re: Silver

              Daily chart frame analyses:

              Daily chart from ke upar analysis karen to important hai ki seller aaj ke din Koi Aisi date ya koi Aisi news release Nahin Hui price ke upar Jo Ham resistance line Aur Ko decline Karen channel ko aur bullish correction Karen Hamari correct price per current price per Agar Ham calculate Karen Har chij correctly To Ham Dekhenge ke bare news channel is time impulse kar raha hai uska maksad market ko down Lekar aana hai jo Hamara tha opening Mein sport level ko usko trading range Ham market Mein Mar karen 22.40 to main Apna Jo level mark kiya hai option vah Hamara am Hai Jo hamari situation changed dramatically hoti rahti Agar Hamari Koi bol open channel resistance Hui To Ham usmein consolidate Karenge Ham above resistance level ko Maar Karenge joke hain 22.90 aur Agar yah throwing into zone 5 Rahi To Ham is case Mein consolidation ko breakout zone bhi kar sakte hai


              Click image for larger version

Name:	d1 (1).png
Views:	1
Size:	26.7 کلوبائٹ
ID:	12358706

              Four hourly chart frame analyses:

              Agar Ham situation Ko Dekhe to yah samajhna Aasan Nahin Hai Ki is time Humko selmy entry ka channel Jo prevent show ho raha hai Hamen reopening karna chahie breakout zone (red square) ke resistance level ke upar aur Sathi Humne Apne resistance level ko move kar dena chahie Jo kehe 222.79 notice Kare to bol is time try kar raha hai gain a foothold per aur Breakout karne ki koshish kar raha hai lekin vah ismein fail hai according to ki Ham Jante Hain ke is time Ham dekh sakte hain Falls Trek jismein Humne market Khari test level bhi check kar sakte hain aur Agar market is level Kohli test Karti Hai To Hamen Ek acchi movement dekhne ko Milegi aur usmein ham Barish impulse Dekhenge technically return ho sakti hai but now Ham theory mein agar Dekhe To Hamara Barrage Township word impulse Mein Jude hai jo Hamen confirmation kar raha hai bearish scenario ke upar
              Click image for larger version

Name:	h4 (1).png
Views:	1
Size:	24.8 کلوبائٹ
ID:	12358707
               
              • #52 Collapse

                Re: Silver

                I love the silver and h4 charts to analyze the work today. As soon as the market price broke the trend line, the market began to rise rapidly, but the market tried to raise the resistance level but failed. Current market price closes below 23. At the same time, the dollar index is still in the range between the support level of 96 and the resistance level of 96.25. It recently settled below 96 but failed to create enough momentum and rose to 96.15. If the dollar index is above 96.25, it will exceed the resistance of 96.50, which will benefit the free silver price. Gold learned resistance level in 1815. If gold can stabilize after 1815, it will gain more momentum at the top and continue the next resistance in 1830, growing in silver.During H4, the market tested the support level at 23:00. If the market price stabilizes below, it will have a lower pressure and go to the next support level, 22.70. A break below the support level of 22.70 will lower the market price to a support level of 22.20. If the market price falls below the support level of 22.20, it will move to the next support level, 21.60. In terms of resistance, the previous support level of 23.35 serves as the first level of resistance to market prices. If the market price exceeds this, the next resistance level will be 23.80. An effective resistance test will allow you to test the next resistance level at 24.30. If the market does not break this support, it may rise again.
                 
                • #53 Collapse

                  Re: Silver

                  silver technology ka tajziamein takneeki tajzia ke liye silver ke jore ka intikhab karta hon. market taizi se agay barhi aur neechay ke rujhan ko badhaane ki koshish ki lekin nakaam raha. jabkay market is waqt 23. 15 se oopar band honay ki koshish kar rahi hai, dollar index kamyabi se 96 ki support level se oopar band ho gaya hai aur 95. 50 par support ko azmaane ki koshish kar raha hai. agar dollar index 95. 50 se neechay girta hai to yeh market ki qeematon par 95. 35 tak barh jaye ga. sonay ne 1820 mein muzahmat ki satah ko kamyabi se uboor kya aur 1830 mein, agli muzahmati satah ka tajurbah kya. agar sonay ki qeemat 1833 mein girty hai, to yeh sab se oopar par ziyada dabao daaley ga aur muzahmat ki agli satah, 1840 chandi ke billion par chala jaye ga .market fi ghanta chart par 23. 15 par muzahmat ki jaanch kar raha hai. agar market ki qeemat is satah se oopar mustahkam hoti hai, to yeh 23. 30 par agli muzahmati satah par chali jaye gi. 23. 30 break rizstns 23. 50 par rizstns test khole ga. agar market ki qeemat is satah se barh jati hai, to yeh 23. 75 par muqaabla jari rakhay gi. mutaliqa energy index 57 hai, jo aik ahem kharidari ke dabao ki nishandahi karta hai. jahan tak support ka talluq hai, market ki qeematon ke liye aakhri support 23. 00 hai. agar market ki qeemat is satah se neechay hai, to yeh aglay support level, 22. 75 par chali jaye gi. is support level se neechay ka waqfa market ki qeemat ko 22.50 ki support level ke qareeb le aaye ga. agar market muzahmat ko nahi toar sakti to mein is ki himayat ki tawaqqa karta hon. agar market support ko toar deta hai, to yeh gir sakta hai aur 50 saada mutharrak mahol ki jaanch kar sakta hai .I love the silver and h4 charts to analyzork today. As soon as the market price broke the trend line, the market began to rise rapidly, but the market tried to raise the resistance level but failed. Current market price closes below 23. At the same time, the dollar index is still in the range between the support level of 96 and the resistance level of 96.25. It recently settled below 96 but failed to create enough momentum and rose to 96.15. If the dollar index is above 96.25, it will exceed the resistance of 96.50, which will benefit the free silver price. Gold learned resistance level in 1815. If gold can stabilize after 1815, it will gain more momentum at the top and continue the next resistance in 1830, growing in silver.During H4, the market tested the support level at 23:00. If the market price stabilizes below, it will have a lower pressure and go to the next support level, 22.70. A break below the support level of 22.70 will lower the market price to a support level of 22.20. If the market price falls below the support level of 22.20, it will move to the next support level, 21.60. In terms of resistance, the previous support level of 23.35 serves as the first level of resistance to market prices. If the market price exceeds this, the next resistance level will be 23.80. An effective resistance test will allow you to test the next resistance level at 24.30. If the market does not break this support, it may rise again.
                   
                  • #54 Collapse

                    Re: Silver

                    Silver Price Technical Analysis
                    Agar Ham ability Dekhe break ki jo 21 dollar price level hai jo ki lete Karen price drop ko $20 aur $19 ki sport level ko aur Agar Ham yahan se bol kar Dekhe To Ham 22 level Uske bad hi Ham Javan Honge extent Karenge police ki trend Koi $23 aur $24 ke price ka level hoga

                    Daily Chart

                    Silver Ki Bearish long-term Outlook Ko Dekhe to Iske daily chat ke upar Hamen price ki jo movement from kari hai double bottom chat ke upar Sath hi price Kyon begin carrier rise to word 23 dollar market Jo indicating Kariye positive trend last week mein Humne white metal Ko Dekha Kyon positive trend per hai aur lekin on January 3 mein Hamen bearish ki candle a Hui Joker daily chart per Hain Jo negative chart pattern ko show khadi hai jo metal ki price of all ki thi 21 dollar ke support Jo lekin Uske bad price Mein ful bacchon wali train continue hua

                    Click image for larger version

Name:	d1.png
Views:	1
Size:	27.7 کلوبائٹ
ID:	12362310


                    Agar Ham Iske increment Dekhe Jo negative force kar raha hai silver ki cost exchanging and time frame for 21 time frame Ema Jiski general strength to give the file have period were 14 Se Lekar 40 period level hai aur yah sine line kara guideline for tension again ko jo imply Kariye purchasing ke flag Koi Aur shaadi ki capacity on separate Dekhkar vah 21 dollar value result Mein Hamen Jo dimension $20 aur sath mein 19 support level Jo Bhul ko belt Karenge iskina Ji ko aur proceed Karegi police pattern ke Jis per Ham assuming Karenge chapter $22 coast ki level Hogi Jiske increment per Hamen 23 Dollar aur sath mein 24 dollar value level hoga

                    4_Hour Chart

                    Silverado negative for time diagram main to f twofold base diagram design framed two karna hai to iska set up a set of Hai bullish development ke upar aur iska positive level Jo Hamen 23 Dollar aur jo bear Hamen against Hai bolkar Iski arrangement Hamen negative per frame show ho rahi hai agar Ham Jiski cost ko pullback Karen aur Ford focus Karen Hamen ke level 21 dollar ko jis per cost Hamari attempted to continue bullish pattern ko last week se aur isse week Tak market ki movement same hai


                    Click image for larger version

Name:	4.png
Views:	1
Size:	174.0 کلوبائٹ
ID:	12362309


                    Silver ki cost ko exchanging between 9 timeframe EMA 21 period EMA per Ham Dekhe to overall Hamen skit record ho rahi hai vah 14 period Se Lekar 40 period ke sine line facing kar raha hai jo demonstrate Karen purchasing signal ko
                     
                    • #55 Collapse

                      Re: Silver

                      silver takneeki tajzia


                      sab ko hello, mein chandi ke takneeki tajzia aur h4 chart ko tarjeeh deta hon. agar hum h4 chart ko dekhen to chandi oopar ki taraf ja rahi hai, trained line ke sath chal rahi hai. silver fi al haal 23. 55 se oopar muzahmat ko band karne ki koshish kar raha hai, jabkay dollar index ne haal hi mein 95. 80 se neechay band honay ki koshish ki lekin kaafi neechay ki taraf dabao peda karne mein nakaam raha hai. agar usd index neechay toot jata hai, to yeh 95. 40 par support ki taraf gamzan hoga, jo chandi par taizi ka baais hoga. sonay ko 1845 ke aas paas mazboot himayat haasil hui aur 1860 ke baad taizi se barh gayi. agar sonay ki qeematein 1860 ke oopar band hoti hain, to yeh 1875 mein apni muzahmat jari rakhay ga, chandi par taizi .

                      h4 chart

                      Click image for larger version

Name:	2.png
Views:	1
Size:	48.5 کلوبائٹ
ID:	12370833

                      h4 chart mein, qeemat 23. 15 par muzahmat ke oopar band hai aur agli muzahmat ko 23. 55 par check karti hai. agar laagat is satah se barh jati hai, to yeh 23. 95 par agli muzahmat ki taraf ishara kere gi. 23. 95 par muzahmat se oopar ka waqfa 24. 30 par taaza tareen muzahmati test ka rasta khol day ga. agar qeemat 24. 30 par muzahmat ko toar deti hai, to yeh 24. 60 ki agli satah par chali jaye gi. h4 chart mein, rsi 52 par hai, jo aik ghair janabdaar market ke jazbaat ki nishandahi karta hai, aur hum taizi ke rujhan ki taraf anay ki tawaqqa karte hain. lanch se pehlay, chandi ko jald hi raftaar haasil karne ka mauqa haasil karne ke liye 23. 15 se neechay rehne ki zaroorat hai. baad mein qeemat ki himayat 22.55 par hai. neechay ka waqfa qeemat ko 22.55 ki satah par le aaye ga. agar qeemat 22. 0 se neechay toot jati hai, to yeh 21. 75 par agli support par chali jaye gi. mein ne chart ko nishaan zad kya hai, aur mujhe lagta hai ke market is terhan chal sakti hai. agar chandi 23. 55 par apni muzahmat ko nahi torti hai, to test ke baad is ki trained line ka dobarah jaiza liya ja sakta hai. test ke baad, hum dekh satke hain ke market mein izafah hota hai .
                      • #56 Collapse

                        Re: Silver

                        Assalamo Alaikum! Dear members and good morning!
                        Dear members silver ki current situation bearish trend ko show kr rahi hain
                        Pichle kuch dinon se iski movement upward trend mein thi
                        Filwaqt ye thora or upward move karegi tab hum sell ki entry le sakte hain. Thanks
                        • #57 Collapse

                          Re: Silver

                          4 hours time frame technical outlook:

                          H4 timeframe main silver price Friday ko 21.71 levels pay market k closing k sath he closed ho gai. Currently, silver pair price 50 and 100 SMA k darmiyan trading kar rahi hai, price last week main 22.60 level below break karne k baad usi level say dubara declined honay k baad neechay 20.40 level ko tests karnay k baad declinde ho kar bounce hona start ho gai. 4 hours chart main stochastic indicator 20 levels ko test kar raha hai. Osma indicator bhi sell ka aik signal show kar chuka hai. Agar Monday ko market k start honay k sath price dubara bullish movements start karty hai aur upper 22.60 area ko buy break karty hai to price main dubara buy entry k chances open ho saktay hain, jis say price phir 23.60 aur usk baad 24.40 resistance levels ko test kar sakty hai. Agar price monday ko 22.60 level say declined hoty ha to tab isk sell entry k chance open ho saktay hain jis say price neechay 20.40 aur phir 19.55 support area ko test kar sakty hai. Mairay analysis k mutabik, price central area 22.60 say sell break k baad stay kar chuki hai jis mein is k zyada tar chances neechay support levels ko test karne k han.

                          Click image for larger version

Name:	silver h4.png
Views:	1
Size:	63.7 کلوبائٹ
ID:	12395447


                          Daily time frame technical outlook:

                          Daily tiem frame main silver pair price ka trend sell confrim honay k baad price 20.41 support levels say declined honay k baad kuch correction kar rahi hai. Stochastic indicator daily chart par bounce kartay huway 80 level ko test kar raha ha.Osma indicator sell confirmation k baad kuch retracement kar raha hai. Agar Monday market open k baad silver price apni movement ko jari rakhty hai aur 22.60 central area ko bullish breakout karnay main success hoty hai to price main buy ki dubara entry possible hai aur price 23.60 phir 24.40 resistances ko test kar sakty hain. Agar price 22.60 area say declined hoty hai to t ham is k sell main entry put kar saktay hain jis main traders ka target neechay 20.41 aur phir 19.55 levels hongay. Mairay analysis k mutabik, Silver price sell trend main confirm ho chukka hai jis say market k ziada tar chances neechay support levels ko test karnay k ban saktay hain.

                          Click image for larger version

Name:	silver d1.png
Views:	1
Size:	71.8 کلوبائٹ
ID:	12395448
                           
                          • #58 Collapse

                            Re: Silver

                            M30 time frame technical outlook:

                            M30 chart main Silver price 21.65 pivot point aur 21.95 resistance levels k darmiyan trading kar rahi hai. Price 21.65 central point say strong breakout k baad declined bhi ho chuki hai. Stochastic indicator 0 point say oversold ho kar bullish movements start kar chuka hai. MACD indicator bhi same movements k sath apni runing main rawan dawan hai. Currently, price 21.65 pivot point k uper running kar rahai hai. Agar price apni bullish movemets ko continue rakhty hai to iska target 21.95 resistance aur usk baad next 22.10 resistance levels ho saktay hain. Agar current price rebound hoty hai au sath neechay 21.65 central area ko break below karty hai to price main sell movements k chances start ho saktay hain, jiska target neechay 21.44 aur usk baad 21.28 support levels ho saktay hain. Mairay analysis k hisaab say price pivot point area ko bullish breakout kar chuki hai aur isk ziada tar chances resistances area ko test karnay k ho saktay hain.


                            Click image for larger version

Name:	m30.png
Views:	1
Size:	56.6 کلوبائٹ
ID:	12397208

                            Hourly chart technical analysis:

                            Hourly time frame main Silver price 21.79 levels pay movement kar rahi hai,Stochastic indicator 0 level pay moveent kar raha hai jo k oversold ho chuka hai. Macd indicator bhi bullish signals show kar raha hai. Agar price apni movement ko bullish jari rakhty hai to iska chance hai k yeh uper 21.95 aur uska baad next 22.10 resistance area ko test kar sakty hai. Agar current price rebound hoty hai aur neechay 21.65 pivot point level ko break karty hai to price main selling start ho sakty hai, jiska target neechay 21.44 aur usk baad 21.28 support levels ho saktay hain. Mairay analysis k hisaab say price aik strong candle k sath bullish movements start kar chuki hai jiska target upper resistance levels ho sakta hai.

                            Click image for larger version

Name:	h1.png
Views:	1
Size:	50.5 کلوبائٹ
ID:	12397209

                            Shukrya.
                               
                            • #59 Collapse

                              Re: Silver

                              Hourly time frame technical analysis:

                              Hourly chart main Silver price 22.15 pivot point area ko strong candle breakout k baad bullish declined kar chuki hai. Stochastic indicator 80 levels say neechay kuch correction k liye movements kar raha hai. RSI 14 indicator 70 levels k kareeb hai jo k bullish signals show kar raha hai. Price strong bullish candle k sath 100 moving averages ko bhi breakout kar chuki hai. Agar current price bullish movements ko continue rakhty hai to iska target ooper 22.48 resistance area ho sakta hai isk baad iska next target 22.65 resistance levels ho sata hai. Agar current positions rebound hoty hai aur sath neechay 22.15 central point ko sell break karty hai to price main sell movements open k chances ban saktay hain jiska target neechay 21.98 aur uskay baad 21.82 support levels ho saktay hain. Mairay analysis k hisaab say price ka major trend bullish hai aur sath price 50 aur 100 moving averages k ooper trading kar rahai hai is liye price resistance areas ko test kar skty hai.


                              Click image for larger version

Name:	h1.png
Views:	1
Size:	61.6 کلوبائٹ
ID:	12399470


                              4 hours time frame technical analysis:


                              4 hours time frame main Silver price aik strong bullish candle k sath 100 moving averages aur 22.15 pivot point area ko kamyabi k sath breakout kar chuki hai. Currently, price 22.15 area say declined ho rahi hai. Stochastic indicator 20 area say bullish movements start kar raha hai. RSI 14 indicator bhi bullish signal show kar raha hai. Agar current price 22.15 area say declined k baad bullish movements ko continue rakhty hai to price main bullish movements strong k baad target 22.48 resistance area ho sakta hai, jisk baad price ka next target 22.65 resistance levels ho sata hai. Agar current price rebounds hoty hai au sath 22.15 pivot point area k neechay break karty hai to price main bearish movements k chances open ho saktay hain jiska target neechay 21.98 aur usk baad 21.82 support levels ho saktay hain. Currently, price ka major trend bullish hai aur sath price 50, 100 moving averages k ooper trading kar rahai hai, is liye price k chances hain k wo resistance area ko test kar sakty hai.

                              Click image for larger version

Name:	h4.png
Views:	1
Size:	63.5 کلوبائٹ
ID:	12399474

                              Shukrya.
                                 
                              • <a href="https://www.instaforex.org/ru/?x=ruforum">InstaForex</a>
                              • #60 Collapse

                                Re: Silver

                                Hourly time frame technical analysis:


                                Hourly time frame main Silver price 22.03 pivot point say strong sell breakout k baad again retest k liye bullish movements kar rahi hai. Currently, price 21.97 levels pay movements kar rahai hai.Stochastic indicator 0 level say oversold ho kar bullish movement start kar raha hai. RSI indicator 30 aur 70 area k darmiyan movements kar raha hai. Agar current price kuch correction k baad sell movements start karty hai to price ka target neechay 21.83 support levels ho sakta hai aur usk baad price ka next target neechay 21.74 support levels ho sakta hai. Agar current situation bounce hoty hai aur sath 22.03 pivot point area ko bullish breakout karti hai to price main bullish movement start honay k chances open ho saktay hain, jisk baad price ka target 22.19 aur 22.80 resistance levels ho saktay hain. Mairay analysis k mutabik, price 50 aur 100 moving averages ko sell crossover kar chuki hai jsika sell signal open ho chuka hai is liye chances hain k price neechay support levels ko test kar sakty hai.


                                Click image for larger version

Name:	h1.png
Views:	1
Size:	64.8 کلوبائٹ
ID:	12399887


                                4 hours time frame technical analysis:


                                4 hours time frame main Silver price 22.03 pivot point area say sell break k baad bullish correction kar rahi hai. Stochastic indicator 80 levels say declined ho kar sell ki movement kar raha hai. RSI 14 indicator normally 30 aur 70 area k darmiyan movements kar raha hai. Agar current price 22.03 central point say decline ho kar sell ki movement start karty hai to price ka target neechay 21.83 support levels ho sakta hai aur usk baad mazeed neechay 21.74 support levels ho sata hai. Agar price bounce hoty hai aur sath 22.03 pivot point area ko bellish breakout karty hai to price main again bullish movements start ho sakty hai jiska target ooper 22.19 aur usk baad 22.28 resistance area ho saktay hain. Mairay analysis k hisaab say aur indicators ki confirmation say price central point ko sell break k baad sell movements start kar chuki hai is liye price k chances hain k wo support levels ko test kar sakty hai.


                                Click image for larger version

Name:	h4.png
Views:	1
Size:	63.6 کلوبائٹ
ID:	12399888


                                Shukrya.
                                   

                                اب آن لائن

                                Working...
                                X