Assalamualaikum dear forex members umeed h app sbb thkk hoongy r apka trading week acha Jara hoga.
Dear members aj hmm bat krengy line r bar chart ki k yd Kia hoty hn to hmm dykhty k hmary took m Kia chzn include hn dear members ajj hmm bat krengy line r bar chart k bary m k ye Kia hoty hn r inky faidy Kia hn.
Forex trading m bar chart;
Dear members bar chart hmn prices k bary m aik bar ki shkl m information dyty hn k bar aik vertical sedhi lime hota b Jo k prices moment ko show krta h jab k bar right side per iper aik horizontal short line hotii h jisko bar k right arm b kaha jata h ye bullish bar m closing price ko show krri h jbky bearish bar m opening price ko show krtii h.
R bar ki left side py aik short horizontal lines hotii h Jo k left arm kehlatii h ye arm bullish bar m opening price jbky bearish bar m closing price ko show kratii h yr bar ki arms k ooper r neechy bar ki length hotii h Jo k prices k high r low ko show kratii h given time period m show m apko pic k tor py dikhata Hoon.
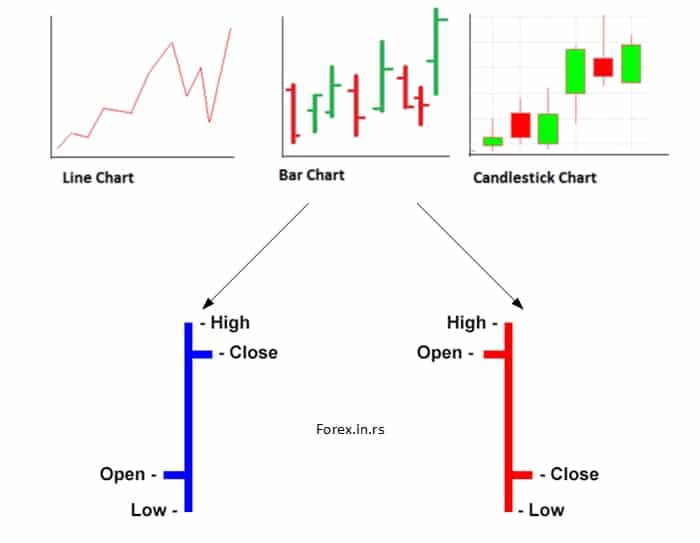
Chart bar k faaidy;;
Dear members bar chart k BHT se faidy hn jaisa k ye price k bary m complete information dyta h kisi ginen time ki ya opening r closing highs lows price btaty hn.jbjky bar ki length is bat ko show kratii h k price ooper ya neechy ja chukii h bar chart technical analysis m b helpful hotii h q k ye volatility trend r reversal k bary mn information dytii h.
Charts of line;
Dear members line chart kisi b chz ki graphics representation ko kehty hn k ye chart different time period ki prices ko apas m Mila k aik line bna lytii h ye chart kisi b trading pair ki traf closing price btata h r hmm iski kisii b time frame m useful krr skty hn.

Line chart k advantages:;
Dear members ye simple r easy to understand hota h r technical analysis ka important tool h k ye closing price btata h isii liye forex m trend ka PTA lgany r breakout ki confirmation k liye line chart use Kia jata h..
Dear members aj hmm bat krengy line r bar chart ki k yd Kia hoty hn to hmm dykhty k hmary took m Kia chzn include hn dear members ajj hmm bat krengy line r bar chart k bary m k ye Kia hoty hn r inky faidy Kia hn.
Forex trading m bar chart;
Dear members bar chart hmn prices k bary m aik bar ki shkl m information dyty hn k bar aik vertical sedhi lime hota b Jo k prices moment ko show krta h jab k bar right side per iper aik horizontal short line hotii h jisko bar k right arm b kaha jata h ye bullish bar m closing price ko show krri h jbky bearish bar m opening price ko show krtii h.
R bar ki left side py aik short horizontal lines hotii h Jo k left arm kehlatii h ye arm bullish bar m opening price jbky bearish bar m closing price ko show kratii h yr bar ki arms k ooper r neechy bar ki length hotii h Jo k prices k high r low ko show kratii h given time period m show m apko pic k tor py dikhata Hoon.
Chart bar k faaidy;;
Dear members bar chart k BHT se faidy hn jaisa k ye price k bary m complete information dyta h kisi ginen time ki ya opening r closing highs lows price btaty hn.jbjky bar ki length is bat ko show kratii h k price ooper ya neechy ja chukii h bar chart technical analysis m b helpful hotii h q k ye volatility trend r reversal k bary mn information dytii h.
Charts of line;
Dear members line chart kisi b chz ki graphics representation ko kehty hn k ye chart different time period ki prices ko apas m Mila k aik line bna lytii h ye chart kisi b trading pair ki traf closing price btata h r hmm iski kisii b time frame m useful krr skty hn.
Line chart k advantages:;
Dear members ye simple r easy to understand hota h r technical analysis ka important tool h k ye closing price btata h isii liye forex m trend ka PTA lgany r breakout ki confirmation k liye line chart use Kia jata h..
تبصرہ
Расширенный режим Обычный режим