Assalam alaikum traders!Aj hum chart patterns main agy barhty hovy naya topic start karty hain HARMONIC Patterns.
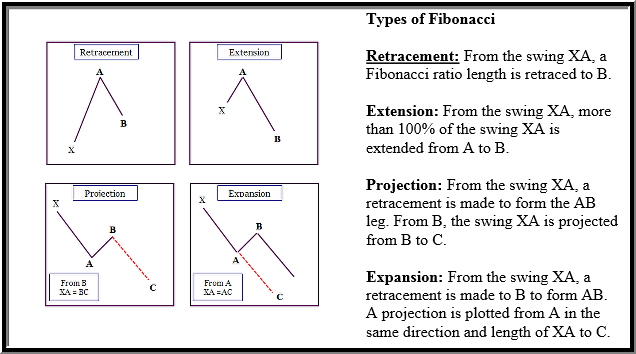
harmonic pattern drasal geomatic shapes hoti hain jo k market main fibonacci levels ko use kr k bnti hain or phr ye hamen market ki next movement k bary main information deti hain.
Top 7 Harmonic chart patterns
aj in main se hum 2 patterns ko discuss karen or baki series ki form main posts main discuss kia krn gy 2,2 kr k.
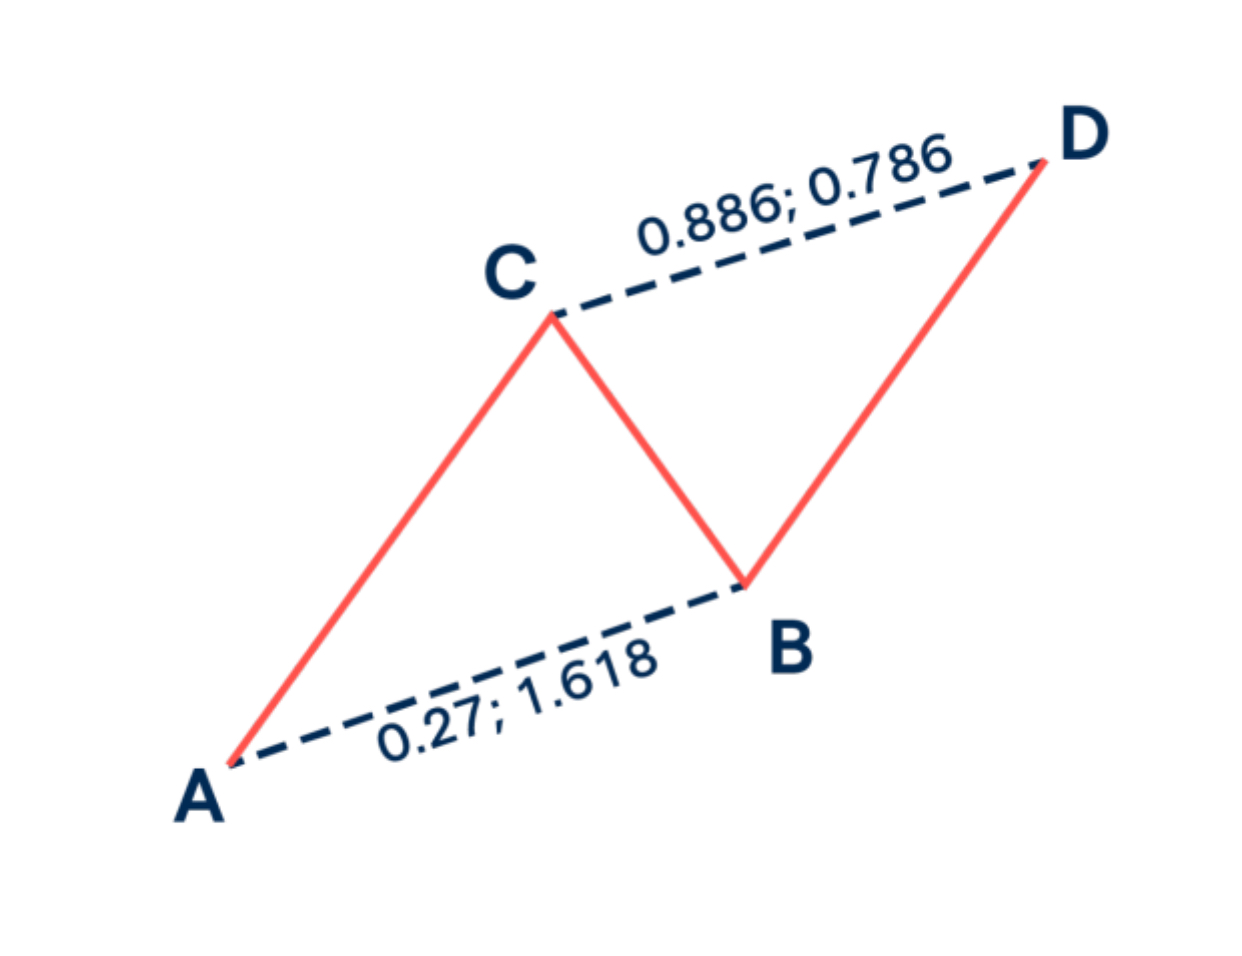
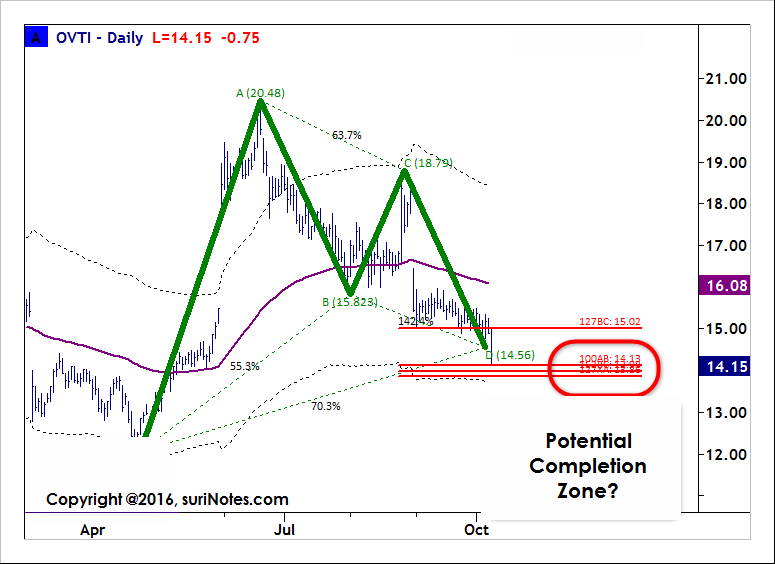
THE ABCD PATTERN
Ye harmonic patterns main se sb se easy pattern ha ye pattern 3 movements or 4 points py mushtamil hota ha.
2 impulsive moves hoti hain or 1 corrective move hoti ha.
1st impulsive move AB hoti ha or phr corrective move hoti ha BC and then impulsive move hoti ha CD estra 4 points ko mila k 1 pattern bn jata ha.
Traders es pattern main C point se entry ke skty hain D tk ya phr patterb complete hony ka wait krna chahye koe bhi entry leny k lye.

THE BAT PATTERN
Es pattern ko BAT pattern es lye kaha jata ha k pattern complete hony py 1 BAT jaosi shape dekhny ko milti ha.
Es main ABCD pattern se 1 extra ray hoti ha jisko leg b kaha jata or 1 extra point ha X k nam se.
1st leg XA hoti ha or us k bad AB retracement hoti ha agr AB retracement XA ki move k 50% ho to ap BAT pattern ka wait kar skty hain.
or es k bad BC move hoti ha jo k 2.18% ho skti ha or us k nad final CD move hoti ha jo k XA k equal ya us se zada ho skti ha.
In sb moves k conplete hony py BAT shape banti ha.
es pattern main traders C pont se trade ke skty hain D point tk or es main stop loss C se thora opr ho ga.


harmonic pattern drasal geomatic shapes hoti hain jo k market main fibonacci levels ko use kr k bnti hain or phr ye hamen market ki next movement k bary main information deti hain.
Top 7 Harmonic chart patterns
- THE ABCD pattern
- The BAT pattern
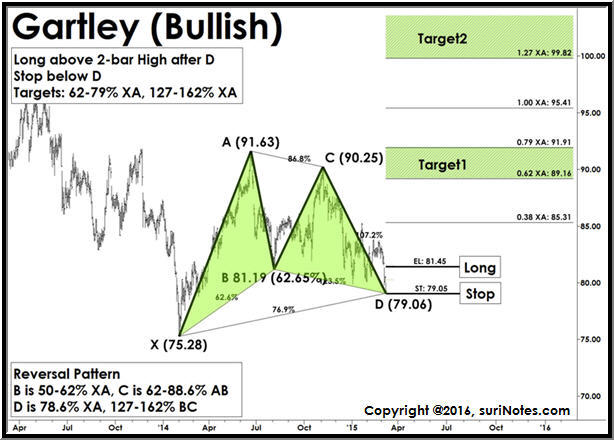
- The GARTLEY patterb
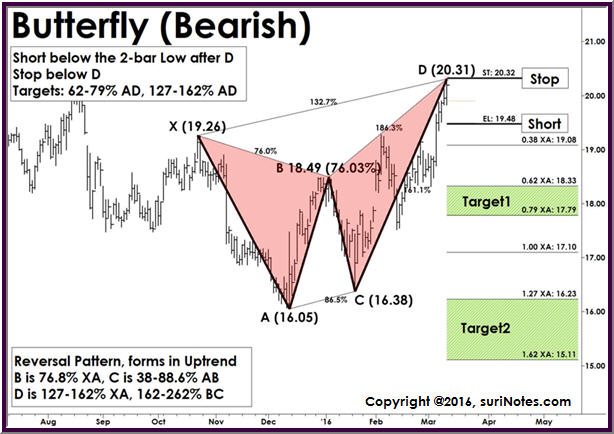
- The BUTTERFLY pattern
- The CRAB pattern
- The SHARK pattern
- The DEEP CRAB pattern
aj in main se hum 2 patterns ko discuss karen or baki series ki form main posts main discuss kia krn gy 2,2 kr k.
THE ABCD PATTERN
Ye harmonic patterns main se sb se easy pattern ha ye pattern 3 movements or 4 points py mushtamil hota ha.
2 impulsive moves hoti hain or 1 corrective move hoti ha.
1st impulsive move AB hoti ha or phr corrective move hoti ha BC and then impulsive move hoti ha CD estra 4 points ko mila k 1 pattern bn jata ha.
Traders es pattern main C point se entry ke skty hain D tk ya phr patterb complete hony ka wait krna chahye koe bhi entry leny k lye.
THE BAT PATTERN
Es pattern ko BAT pattern es lye kaha jata ha k pattern complete hony py 1 BAT jaosi shape dekhny ko milti ha.
Es main ABCD pattern se 1 extra ray hoti ha jisko leg b kaha jata or 1 extra point ha X k nam se.
1st leg XA hoti ha or us k bad AB retracement hoti ha agr AB retracement XA ki move k 50% ho to ap BAT pattern ka wait kar skty hain.
or es k bad BC move hoti ha jo k 2.18% ho skti ha or us k nad final CD move hoti ha jo k XA k equal ya us se zada ho skti ha.
In sb moves k conplete hony py BAT shape banti ha.
es pattern main traders C pont se trade ke skty hain D point tk or es main stop loss C se thora opr ho ga.

تبصرہ
Расширенный режим Обычный режим