Importance of "Bullish Harami Candlestick Pattern" in Forex Trading :
Assalam-o-alakum dear forex umeed krta hon k ap kheriyat sy hon gy. Dear forex members forex trading ak boht risky business hai. Agr thek sy forex market ka knowledge or is ka experience na ho to is mai hamen bohot loss ho sakta hai. Dear members aj mai ap sy forex market k ak important pattern k bary mai apna knowledge shear krnga.
Importance of Candlestick Pattern :
Dear forex members forex trading mai use hony wala ye pattern bohot important hota hai. Ye forex trading mai ak important role play krty hai. Is ki help sy hum ak achi successful or profitable trading kr sakty hen. Is pattern mai hamen market trend ki future prices ka bohot achy sy pata chalta hai. Is pattern mai hamen market trend ki future prices ka bohot achy sy pata chalta hai. IsIs pattern mai hum market kaka technical analysis krty huwy market prices ko study krty huwy is ka analysis bohot asani sy complete kr sakty hen. Lakin is k leye hamen is pattern ka knoknowledge or is ka experience hona bohot important hota hai.
Harami Candlestick :
Dear forex members forex trading mai Harami candlestick pattern ak trend reversal pattern hai. Jo k long bullish or Bearish trend k end pr banta hai. Japanese language mai Harami word ka mtlb phragnant hai. Is pattern mai first candle long bullish /bearish banti hai. Or second candle first candle k real body mai sy open hoti hai. Or real body k andr he apna close deti hai. Is leye aisa lagta hai k first candle phragnant ho. Isi waja sy is candle ka namm bi Harami Candlestick rakha gaya hai.

Bullish Harami Candlestick Pattern :
Dear forex members forex trading mai bullish harami candlestick pattern ak bearish trend reversal pattern hai. Ye currency pairs or commodities ki price chart mai bearish trend k bottom pr sopport level pr banta commonly nazar aany wala pattern hai.
Identification of Bullish Harami Candlestick Pattern :
Dear forex members forex trading mai bullish harami candlestick pattern two candles sy mil kr banta hai.
1). First Candle :
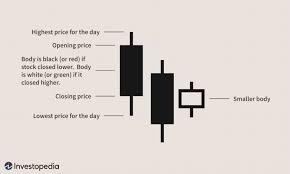
Dear forex members is pattern ki pehli candle long real body ki black candle hoti hai. Jo k market mai strong seller pressure k hold ka batati hai.
2). Second Candle :
Dear forex members is pattern ki second candle Gap up k sath first candle ki real body mai sy open hoti hai. Or thora sa price change dy kr first candle ki real body mai he close deti hai. Or aisa lagta hai k first black candle phragnant ho.
Second candle ki real body first candle ki real body ka 25% sy zyada nahe hona chaheye. Warna pattern bullish harami nahe ho ga. Or trade signal bi valid nahe ho ga.

Trading with Bullish Harami Candlestick Pattern :
Dear forex members bullish harami candlestick pattern k banny k bad new candle k open k sath hamen apni buy ki trade ko active krna chaheye. Stop loss ko first black candle ki low sy nechy place krna chaheye. Or take profit ko next resistance level pr place krna chaheye.

Bullish Harami Candlestick Pattern k sath agr hum Kisi technical indicator ko bi use kren to trade ki mazeed confirmation mil jati hai. Agr hum Relative Strength Index Indicator (RSI) ko is pattern pr use kren to is sy is pattern ki formation k doran RSI Oversold (30 level sy nechy) area mai honi chaheye. Or trade entry k wakt RSI 30 level ko Cross above kr raha ho.
<font size="2">
Assalam-o-alakum dear forex umeed krta hon k ap kheriyat sy hon gy. Dear forex members forex trading ak boht risky business hai. Agr thek sy forex market ka knowledge or is ka experience na ho to is mai hamen bohot loss ho sakta hai. Dear members aj mai ap sy forex market k ak important pattern k bary mai apna knowledge shear krnga.
Importance of Candlestick Pattern :
Dear forex members forex trading mai use hony wala ye pattern bohot important hota hai. Ye forex trading mai ak important role play krty hai. Is ki help sy hum ak achi successful or profitable trading kr sakty hen. Is pattern mai hamen market trend ki future prices ka bohot achy sy pata chalta hai. Is pattern mai hamen market trend ki future prices ka bohot achy sy pata chalta hai. IsIs pattern mai hum market kaka technical analysis krty huwy market prices ko study krty huwy is ka analysis bohot asani sy complete kr sakty hen. Lakin is k leye hamen is pattern ka knoknowledge or is ka experience hona bohot important hota hai.
Harami Candlestick :
Dear forex members forex trading mai Harami candlestick pattern ak trend reversal pattern hai. Jo k long bullish or Bearish trend k end pr banta hai. Japanese language mai Harami word ka mtlb phragnant hai. Is pattern mai first candle long bullish /bearish banti hai. Or second candle first candle k real body mai sy open hoti hai. Or real body k andr he apna close deti hai. Is leye aisa lagta hai k first candle phragnant ho. Isi waja sy is candle ka namm bi Harami Candlestick rakha gaya hai.
Bullish Harami Candlestick Pattern :
Dear forex members forex trading mai bullish harami candlestick pattern ak bearish trend reversal pattern hai. Ye currency pairs or commodities ki price chart mai bearish trend k bottom pr sopport level pr banta commonly nazar aany wala pattern hai.
Identification of Bullish Harami Candlestick Pattern :
Dear forex members forex trading mai bullish harami candlestick pattern two candles sy mil kr banta hai.
1). First Candle :
Dear forex members is pattern ki pehli candle long real body ki black candle hoti hai. Jo k market mai strong seller pressure k hold ka batati hai.
2). Second Candle :
Dear forex members is pattern ki second candle Gap up k sath first candle ki real body mai sy open hoti hai. Or thora sa price change dy kr first candle ki real body mai he close deti hai. Or aisa lagta hai k first black candle phragnant ho.
Second candle ki real body first candle ki real body ka 25% sy zyada nahe hona chaheye. Warna pattern bullish harami nahe ho ga. Or trade signal bi valid nahe ho ga.
Trading with Bullish Harami Candlestick Pattern :
Dear forex members bullish harami candlestick pattern k banny k bad new candle k open k sath hamen apni buy ki trade ko active krna chaheye. Stop loss ko first black candle ki low sy nechy place krna chaheye. Or take profit ko next resistance level pr place krna chaheye.
Bullish Harami Candlestick Pattern k sath agr hum Kisi technical indicator ko bi use kren to trade ki mazeed confirmation mil jati hai. Agr hum Relative Strength Index Indicator (RSI) ko is pattern pr use kren to is sy is pattern ki formation k doran RSI Oversold (30 level sy nechy) area mai honi chaheye. Or trade entry k wakt RSI 30 level ko Cross above kr raha ho.
<font size="2">
تبصرہ
Расширенный режим Обычный режим