Bullish Harami Candlestick Pattren:
-
Umair420Senior Member

- Jan 2021
- 614
- 571
- 2059
- 676 USD
-
<a href="https://www.instaforex.org/ru/?x=ruforum">InstaForex</a> -
Umair420Senior Member
- Jan 2021
- 614
- 571
- 2059
- 676 USD
Bullish Harami Candlestick Pattern ek bullish reversal pattern hai, jise technical analysis mein istemal kiya jata hai. Is pattern mein do consecutive candlesticks hote hain, jahan pehla candlestick bearish (downward) trend ko represent karta hai aur dusra candlestick bullish (upward) trend ko represent karta hai. Bullish Harami Candlestick Pattern ki tafseel sa wazahat is tarah hai:1. Downtrend: Bullish Harami pattern typically downtrend ke baad appear hota hai, jahan price levels down direction mein move kar rahe hote hain.2. First Candle: Pehla candlestick bearish (downward) candle hota hai, jismein selling pressure dikhta hai. Is candle ki range (high aur low) relatively large hoti hai.3. Second Candle: Dusra candlestick bullish (upward) candle hota hai, jismein buying pressure dikhta hai. Is candle ki range pehle candle ki range se kam hoti hai. Is candle ki body pehle candle ki body ke andar fit hoti hai.4. Confirmation: Bullish Harami pattern ka confirmation next candlestick ka behavior aur price movement se hota hai. Agar next candlestick is pattern ke bullish trend ko confirm karta hai aur price levels ko upar le jata hai, toh yeh pattern ki validity ko strengthen karta hai.Bullish Harami Candlestick Pattern ki wazahat yeh hoti hai ki is pattern ke appearance se selling pressure kam ho jati hai aur buying pressure increase hoti hai, jisse price levels ko upar le jane ki possibility hoti hai. Yeh pattern bullish reversal ke indication ke taur par interpret kiya jata hai.Traders is pattern ko istemal karke entry aur exit points ko identify karte hain. Entry point typically dusre candlestick ke opening price ke above rakha jata hai, jabki stop-loss level pehle candlestick ke low price ke below set kiya jata hai. Profits ke liye, traders take-profit level ko resistance levels ya previous swing high levels ke near set karte hain.Bullish Harami Candlestick Pattern ki tafseel sa wazahat aur trading strategies ko samajhne ke liye, additional technical indicators aur price action analysis ka istemal kiya jata hai.Mujhe ummeed hai ki aapko Bullish Harami Candlestick Pattern ki wazahat samajh mein aayi hogi.
-
Riaz HussainSenior Member
- Mar 2020
- 706
- 790
- 1128
- 949 USD
InstaSpot: کسی بھی EPS اور بینک سے منافع واپس لیں، اور EPS اور cryptocurrencies کے تبادلے پر 7% تک کمائیں۔
Bullish Harami Candlestick Pattern:
Bullish harami candlestick pattern ek bullish reversal pattern hai. Isme pehle ek long bearish candle hota hai, aur uske baad ek small bullish candle, jo pehle bearish candle ke andar fit hota hai. Harami pattern bullish momentum aur trend reversal ka indication deta hai. Is pattern ko identify karne ke liye, aapko pehle bearish candle ke size aur range ko dekhna hoga. Agar next candle pehle bearish candle ke andar fit hai, tab ye ek potential bullish harami pattern ho sakta hai. Confirmation ke liye, aapko next bullish candle ki closing price ka confirmation wait karna chahiye. Agar next candle ke closing price previous bearish candle ke above hai, toh ye ek strong bullish harami pattern hai. Entry point, stop loss, aur target levels set karke aap is pattern ke saath trade kar sakte hain. Lekin, candlestick patterns ko confirm karne ke liye dusre technical indicators ka bhi istemal karna zaroori hai.
How to Trade Bullish Harami:
Bullish Harami candlestick pattern ke saath trading karne ke liye, aap ye steps follow kar sakte hain:
1. Pattern ko identify karein:
Ek lamba bearish candle ke baad, ek chota bullish candle dekhein jo puri tarah se bearish candle ke range mein fit hota hai.
2. Pattern ko confirm karein:
Bullish Harami ke baad wale candle ka confirmation wait karein, jismein dekhein ki woh bearish candle ke high se upar close hota hai.
3. Trade mein enter ho jayein:
Confirmation milne ke baad, aap long position mein enter ho sakte hain.
4. Stop loss set karein:
Risk ko manage karne ke liye, stop loss ko bearish candle ke low ke neeche rakhein.
5. Target set karein:
Support aur resistance levels ya dusre technical analysis tools ke base par target level ko identify karein. Yaad rakhein, pattern ko validate karne ke liye aur informed trading decisions ke liye dusre factors aur indicators ko bhi consider karna zaroori hai. -
FaizaMeharSenior Member
- Jan 2021
- 1612
- 80
- 1900
- 402 USD
Bullish harami candlestick pattern: Forex trading mein "bullish harami" candlestick pattern, traders ke liye ek ahem uptrend reversal signal ho sakta hai. Is pattern ko samajhne ke liye niche di gayi steps ki madad se explain karunga: Pehla Candlestick: Sab se pehle, aik bada bearish (girawat ki taraf ishara karne wala) candlestick hota hai, jo ke ek downtrend ke doran aata hai. Is candlestick ka body lamba hota hai, jisse price neeche gayi hoti hai. Dusra Candlestick: Dusra candlestick ek small bullish (baraqarar ya upar ki taraf ishara karne wala) candlestick hota hai. Iska body pehle candlestick ke andar fit hota hai, iska matlab hai ke iski opening price pehle candlestick ke closing price ke qareeb hoti hai aur iski closing price pehle candlestick ke opening price ke qareeb hoti hai. Jab aap ye pattern dekhte hain, toh iska interpretation hota hai ke market mein bearish pressure kam ho raha hai aur bullish momentum shuru ho sakta hai. Is pattern ko "harami" kehte hain, jo Japanese main "pregnant" ya "with child" ka matlab hota hai, kyunki ye small bullish candlestick pehle bearish candlestick ke andar hoti hai aur lagta hai jaise dono candlesticks ek saath hon. Agar aap bullish harami pattern dekhte hain toh isay ek possible trend reversal ka sign samjha jaa sakta hai aur traders isay buy (khareed) karne ka signal samajh kar trading decisions le sakte hain. Lekin, hamesha yaad rakhein ke ek pattern ko dusri technical analysis tools aur market conditions ke sath consider karna zaroori hota hai trading ke faislon mein. Trading with harami pattern: Forex trading mein "bullish harami" candlestick pattern aik ahem bullish reversal signal hota hai, jo indicate karta hai ke market mein bearish (downward) trend ke baad price mein possible upward move ho sakti hai. Isay "bullish harami" ya "pregnant candle" bhi kehte hain. Is pattern mein do consecutive candlesticks hoti hain: Pehli candlestick: Ye usually ek lambi bearish (downward) candle hoti hai jo existing trend ko represent karti hai. Dusri candlestick: Ye pehli candle ki range ke andar hoti hai aur choti hoti hai. Iska body pehli candle ke body ke andar hota hai. Yani ke dusri candle pehli candle ki taraf "pregnant" hoti hai. Bullish harami pattern dekhte waqt, traders ko lagta hai ke bearish trend weaken ho raha hai aur bullish momentum shuru ho sakta hai. Isay confirm karne ke liye, traders aur technical analysis tools ka istemal karte hain. Jab ye pattern samne aata hai, toh traders consider karte hain ke ab market mein buy (khareed) karne ka potential hai. Lekin, hamesha yaad rakhein ke candlestick patterns ko dusri technical analysis tools aur market conditions ke sath combine karke istemal karna behtar hota hai trading decisions lene ke liey. -
Raheela5Senior Member
- Dec 2021
- 454
- 466
- 281
- 451 USD
Bullish Harami Candlestick Pattren: kai hai "Bullish Harami" ek prakar ka candlestick pattern hai jo technical analysis mein istemal hota hai, khaaskar stock market aur trading ke liye. Yeh pattern usually ek trend reversal indicator ke roop mein dekha jata hai, yaani ki ek downtrend ke baad uptrend ki shuruaat ke sanket ke roop mein use hota hai. Bullish Harami ek do-stage candlestick pattern hota hai, jismein do candles shamil hote hain: Pahla Candle (Bearish): Pahla candle ek downtrend ke dauraan dikhta hai aur ismein ek lamba red (bearish) candle hota hai, jo downtrend ko darust karke chala gaya hai. Ismein market ki giraavat ya kamzori ko darust karta hai. Dusra Candle (Bullish Dusra candle pahle candle ke andar hota hai aur generally chhota hota hai. Is candle ka color green (bullish) hota hai, jo dikhaata hai ki uptrend ki shuruaat ho sakti hai. Is candle ka open pahle candle ke close ke paas hota hai aur close pahle candle ke open ke paas hota hai. Jab aap ye pattern dekhte hain, toh iska interpretation hota hai ke market mein bearish pressure kam ho raha hai aur bullish momentum shuru ho sakta hai. Is pattern ko "harami" kehte hain, jo Japanese main "pregnant" ya "with child" ka matlab hota hai, kyunki ye small bullish candlestick pehle bearish candlestick ke andar hoti hai aur lagta hai jaise dono candlesticks ek saath hon. Bullish Harami pattern ko traders uptrend ki shuruaat ke sanket ke roop mein dekhte hain, aur iska matlab hota hai ki market mein trend reversal ho sakta hai. Is pattern ko validate karne ke liye traders aur technical analysts dusre indicators aur tools ka bhi istemal karte hain. Yaad rahe ki candlestick patterns ka istemal kisi bhi trading decision se pehle thayyi se karne chahiye, aur dusre technical indicators aur market analysis ke saath milake istemal karna behtar hota hai.
-
Trading_EmpireMember
- Sep 2023
- 40
- 1
- 39
InstaSpot: کسی بھی EPS اور بینک سے منافع واپس لیں، اور EPS اور cryptocurrencies کے تبادلے پر 7% تک کمائیں۔
What Is Bullish Harami Candlestick Chart Pattern: Bullish Harami" ek prakar ka candle design hai jo specialized analysis mein istemal hota hai, khaaskar securities exchange aur exchanging ke liye. Yeh design generally ek pattern inversion marker ke roop mein dekha jata hai, yaani ki ek downtrend ke baad upswing ki shuruaat ke sanket ke roop mein use hota hai.Bullish Harami ek do-organize candle design hota hai, jismein do candles shamil hote hain:Pahla flame ek downtrend ke dauraan dikhta hai aur ismein ek lamba red (negative) candle hota hai, jo downtrend ko darust karke chala gaya hai. Ismein market ki giraavat ya kamzori ko darust karta hai. Dusra flame pahle light ke andar hota hai aur by and large chhota hota hai. Is flame ka variety green (bullish) hota hai, jo dikhaata hai ki upswing ki shuruaat ho sakti hai. Is light ka open pahle flame ke close ke paas hota hai aur close pahle candle ke open ke paas hota hai.ullish Harami design ko brokers upswing ki shuruaat ke sanket ke roop mein dekhte hain, aur iska matlab hota hai ki market mein pattern inversion ho sakta hai. Is design ko approve karne ke liye dealers aur specialized investigators dusre pointers aur apparatuses ka bhi istemal karte hain.candlestick designs ka istemal kisi bhi exchanging choice se pehle thayyi se karne chahiye, aur dusre specialized markers aur market examination ke saath milake istemal karna behtar hota hai. Formation Of Bullish Harami Chart Candles Pattern: Bullish Harami candle design ke saath exchanging karne ke liye, aap ye steps follow kar sakte hain ek lamba negative flame ke baad, ek chota bullish light dekhein jo puri tarah se negative candle ke range mein fit hota hai. Bullish Harami ke baad ridge candle ka affirmation stand by karein, jismein dekhein ki woh negative light ke high se upar close hota hai Affirmation milne ke baad, aap long position mein enter ho sakte hain.Risk ko oversee karne ke liye, stop misfortune ko negative flame ke low ke neeche rakhein.Support aur opposition levels ya dusre specialized examination apparatuses ke base standard objective level ko recognize karein.  Ismein pehle ek long negative light hota hai, aur uske baad ek little bullish flame, jo pehle negative candle ke andar fit hota hai. Harami design bullish force aur pattern inversion ka sign deta hai. Is design ko distinguish karne ke liye, aapko pehle negative candle ke size aur range ko dekhna hoga. Agar next flame pehle negative candle ke andar fit hai, tab ye ek potential bullish harami design ho sakta hai. Affirmation ke liye, aapko next bullish candle ki shutting cost ka affirmation stand by karna chahiye. Agar next light ke shutting cost past negative flame ke above hai, toh ye ek solid bullish harami design hai. Passage point, stop misfortune, aur target levels set karke aap is design ke saath exchange kar sakte hain. Lekin, candle designs ko affirm karne ke liye dusre specialized markers ka bhi istemal karna zaroori hai. Bullish Harami Chart Pattern Identification: Bullish Harami design regularly downtrend ke baad seem hota hai, jahan cost levels down heading mein move kar rahe hote hain.2. First Flame: Pehla candle negative (descending) candle hota hai, jismein selling pressure dikhta hai. Is flame ki range (high aur low) somewhat huge hoti hai.3. Second Flame: Dusra candle bullish (up) candle hota hai, jismein purchasing pressure dikhta hai. Is light ki range pehle flame ki range se kam hoti hai. Is light ki body pehle flame ki body ke andar fit hoti hai.4. Affirmation: Bullish Harami design ka affirmation next candle ka conduct aur cost development se hota hai. Agar next candle is design ke bullish pattern ko affirm karta hai aur cost levels ko upar le jata hai, toh yeh design ki legitimacy ko fortify karta hai.Bullish Harami Candle Example ki wazahat yeh hoti hai ki is design ke appearance se selling pressure kam ho jati hai aur purchasing pressure increment hoti ha
 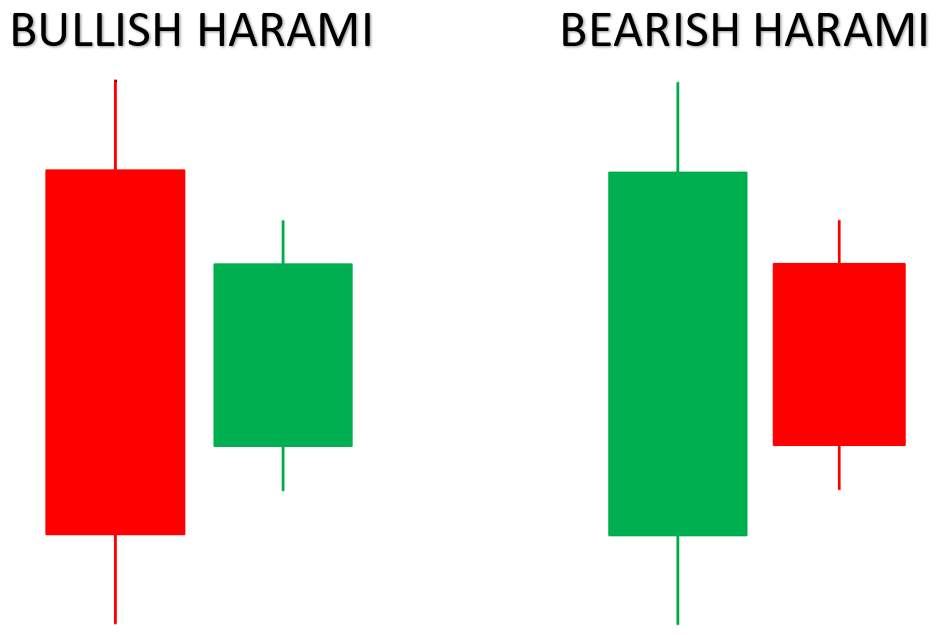 Graph fundamental cost levels ko upar le jane ki plausibility hoti hai. Yeh design bullish inversion ke sign ke taur standard decipher kiya jata hai.Traders is design ko istemal karke section aur leave focuses ko distinguish karte hain. Section point regularly dusre candle ke opening cost ke above rakha jata hai, jabki stop-misfortune level pehle candle ke low cost ke underneath set kiya jata hai. Benefits ke liye, merchants take-benefit level ko opposition levels ya past swing significant levels ke close to set karte hain.Bullish Harami Candle Example ki tafseel sa wazahat aur exchanging systems ko samajhne ke liye, extra specialized pointers aur cost activity investigation ka istemal kiya jata hai.Mujhe ummeed hai ki aapko Bullish Harami Candle Example ki wazahat samajh mein aayi hogi. Trading Of Bullish Harami Candlestick Pattern: Graph Example market brain science ko reflect karta hai, jisme pehle merchants control mein hote hain, lekin phir purchasers ka solid rebound hota hai. Bullish Harami ka istemal karke merchants apne exchanging systems ko refine kar sakte hain aur passage focuses ko distinguish karke potential benefits acquire kar sakte hain.Lekin, har ek specialized marker ki tarah, Bullish Harami bhi 100 percent precise nahi hota aur bogus signs ka risk hota hai. Isliye, judicious gamble the board ke saath iska istemal karna zaroori hai.Bullish Harami Candle Example ek strong inversion marker hai jo merchants ko market patterns ke changes ke uncovered mein alert kar sakta hai. Lekin, iska istemal karne se pehle, careful investigation aur doosre specialized markers ka bhi istemal karna significant hai taake precise exchanging choices liye ja sakein.
  Design ke appearance ke baad, brokers ko cautious perception aur affirmation ke liye extra specialized investigation ka istemal karna chahiye. Bullish Harami ka matlub hai ke venders ki strength kamzor ho sakti hai aur purchasers market control mein aa sakte hain.Bullish Harami ki importance tab zyada hoti hai hit ye noticeable help level ke close dikhai deta hai, kyun ke is circumstance mein pattern inversion ke chances zyada hote hain.Ek fruitful Bullish Harami design ke baad, merchants ko doosre specialized pointers ka bhi istemal karna chahiye taake wo affirm kar sakein ke pattern inversion sharpen wala hai ya nahi. Volume investigation, pattern lines, aur doosre candle designs ka bhi dhyan rakhna significant hai.
-
<a href="https://www.instaforex.org/ru/?x=ruforum">InstaForex</a> -
shahjee289Junior Member
- Oct 2023
- 9
- 1
- 1
Bullish Harami Candlestick INTRODUCTION Bullish Harami ek candlestick pattern hai jo market mein trend change hone ki nishani deta hai. "Harami" Arabic zuban ka lafz hai jo "pregnant" ya "with child" se mutalliq hai, aur isey is wajah se is pattern ko is naam se pehchana jata hai. EXPLAINATION Bullish Harami ek do candle pattern hai jisme pehla candle bearish hota hai, yani ke price down ja raha hai, lekin dusra candle chhota hota hai aur uska close pehle wale candle ke andar hota hai. MOTHER CANDLE Pehla candle trend ko represent karta hai, jo usually down trend mein hota hai. Iska size bada hota hai aur ise "Mother Candle" kehte BABY CANDLE Dusra candle pehle wale candle ke andar hota hai, aur uska size chhota hota hai. Ye bullish hota hai, indicating a potential trend reversal. RESEARCH Bullish Harami ka appearance bullish reversal ki possibility dikhata hai, yani ke market ka trend badal sakta hai. Traders is signal ko samajh kar long positions lena shuru karte hain. Is pattern ka istemal karne se pehle, zaroori hai ke traders proper research karen aur doosre technical indicators ko bhi madde nazar rakhen. USAGE & PRECAUTION Traders ko chahiye ke Bullish Harami signal ko dusre technical indicators ke saath confirm karein aur market conditions ko bhi madde nazar rakhein. Risk management ka bhi khaas khayal rakha jana chahiye taake nuksan se bacha CONCLUTION Bullish Harami Candlestick Pattern ek powerful tool hai jo market ke potential trend reversals ko detect karne mein madad karta hai. Lekin, hamesha yaad rahe ke kisi bhi ek indicator par pura bharosa na karein aur market analysis mein diversity laayein.


Working...
تبصرہ
Расширенный режим Обычный режим